|
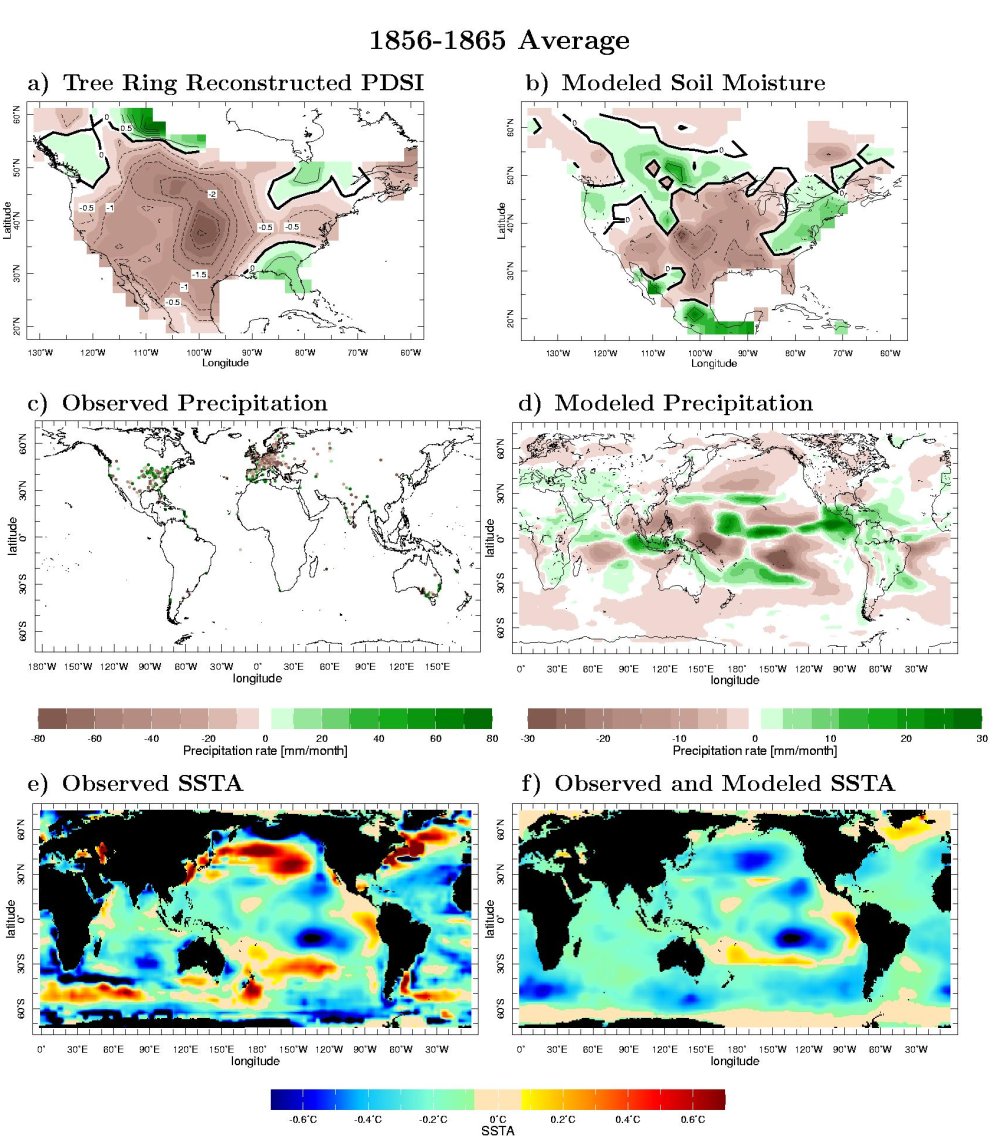
The 1856-1865 Civil War drought. Top left: the tree ring reconstructed Palmer Drought Severity Index (PDSI, a measure of summer drought severity). Top right: the soil moisture anomaly as simulated by the climate model forced by tropical Pacific SSTs alone.
Middle row: the observed from rain gauges (left) and modeled (right) global precipitation
anomaly.
Bottom left: the observed SST anomaly during the drought is shown.
Bottom right: the SST anomaly in the POGA-ML model which is the observed SST anomaly in the tropical Pacific and that computed by a simple ocean model elsewhere.
Units are mm per month for precipitation and deg C for temperature.
|