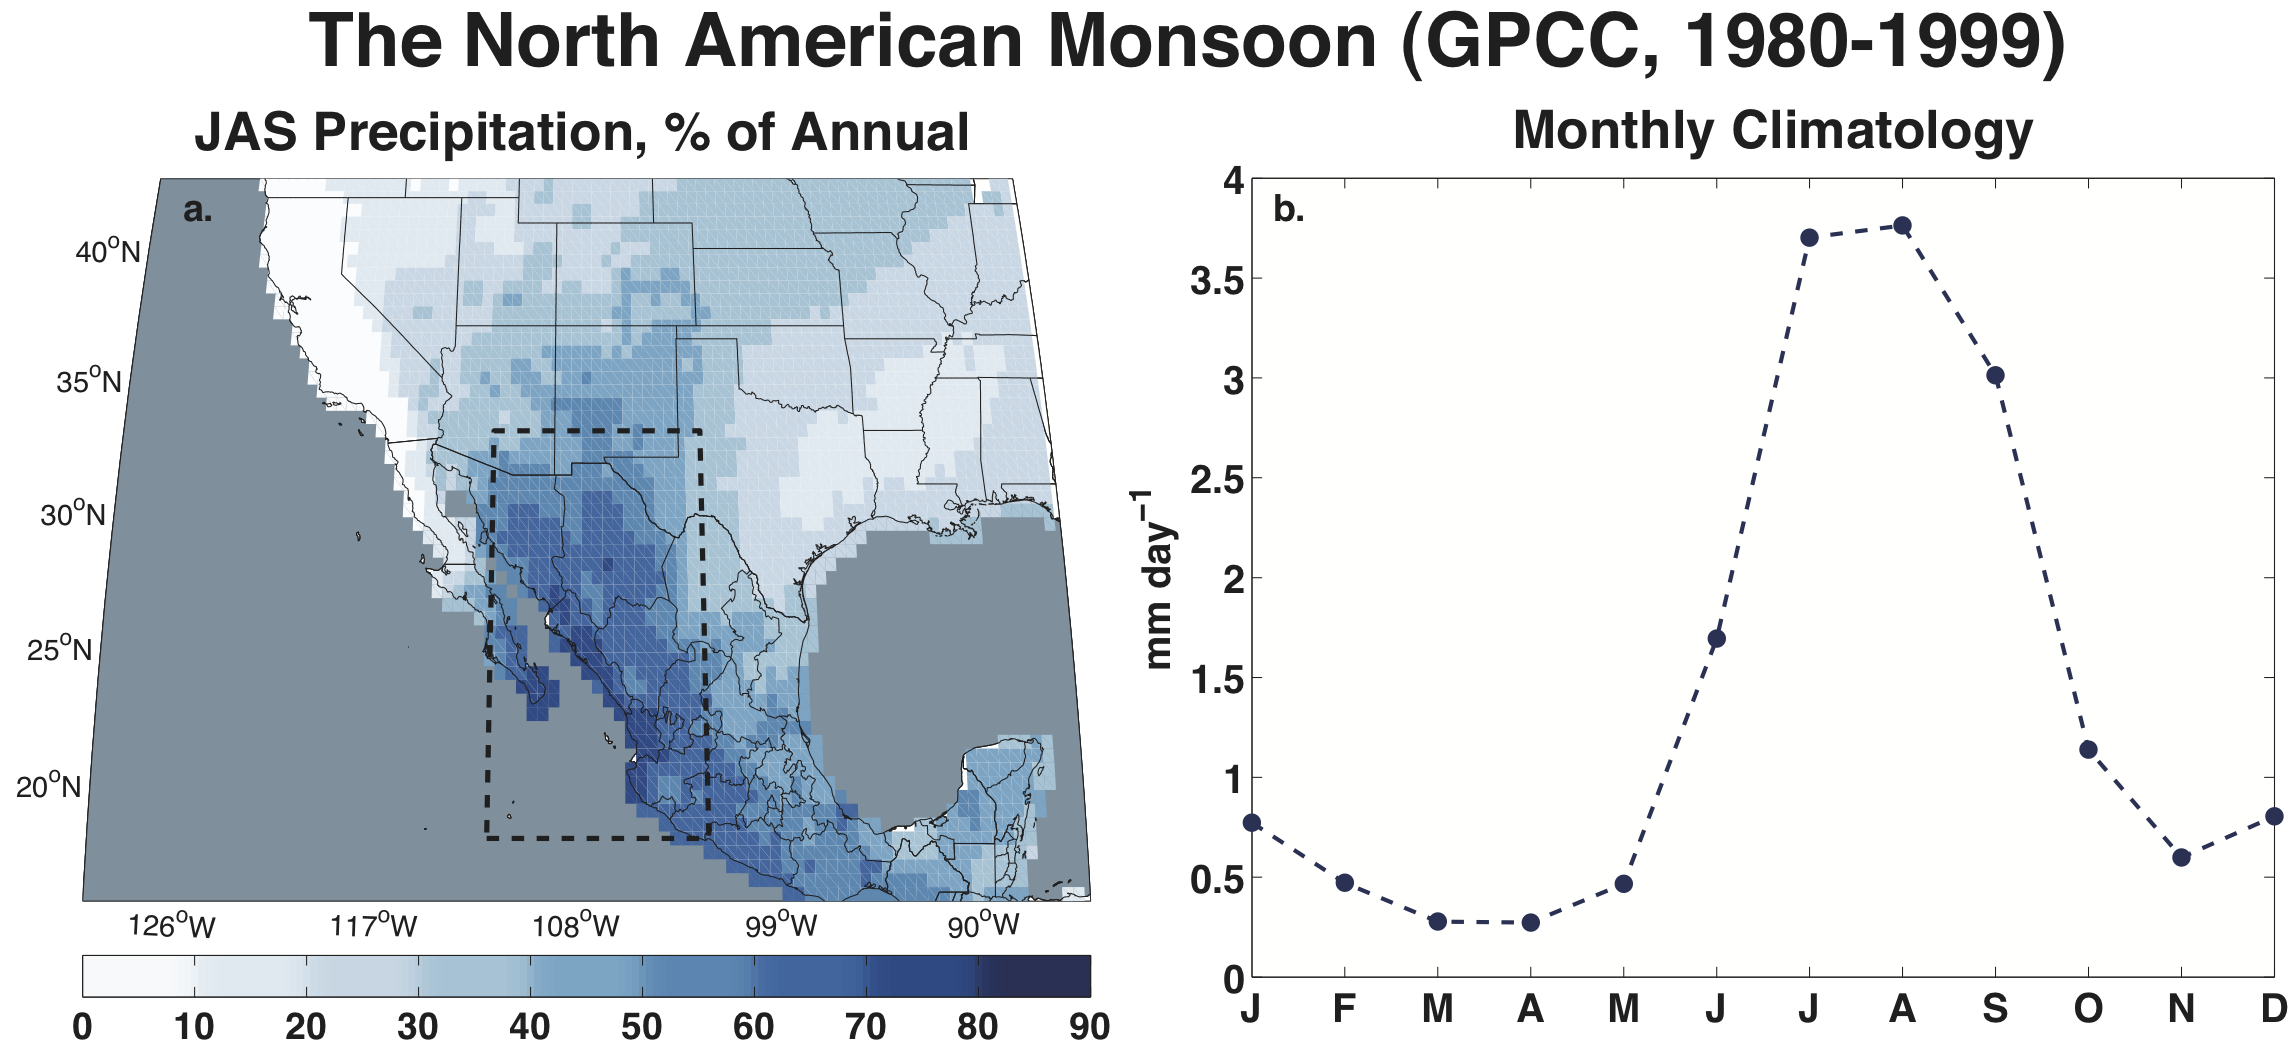
The Future of the North American Monsoon Ben Cook (NASA GISS and Lamont Doherty Earth Observatory) The North American Monsoon (NAM) may be a poor relation of the majestic Asian monsoon but is nonetheless a real monsoon that provides important rainfall to Central America, Mexico and the interior parts of the southwestern U.S. (primarily Arizona and New Mexico). In Mexico and Central America the NAM is critical for water supply and agriculture since winter precipitation in these regions is so small. In the southwest U.S. winter precipitation, arriving at a time of low evapotranspiration, is critical to water supply but the NAM precipitation remains important for soil and groundwater recharge, ecosystems, rainfed and rangeland farming and for fire. It is well known that climate change driven by rising greenhouse gases will cause a reduction of winter precipitation in southwest North America but less attention has been paid to the future of the NAM. In (Cook and Seager, 2013) we assessed model projections of the NAM in the new CMIP5 models that will be assessed within IPCC AR5. The NAM is, within its core region along the west coast of Mexico, an authentic monsoon. Here there is a single precipitation maximum in the summer, a reversal in the direction of the low level wind between winter and summer and an abrupt onset of monsoon rains in June and cessation in September. The NAM is clearly influenced by topography with maximum rains to the west of the Sierra Madre Occidental.
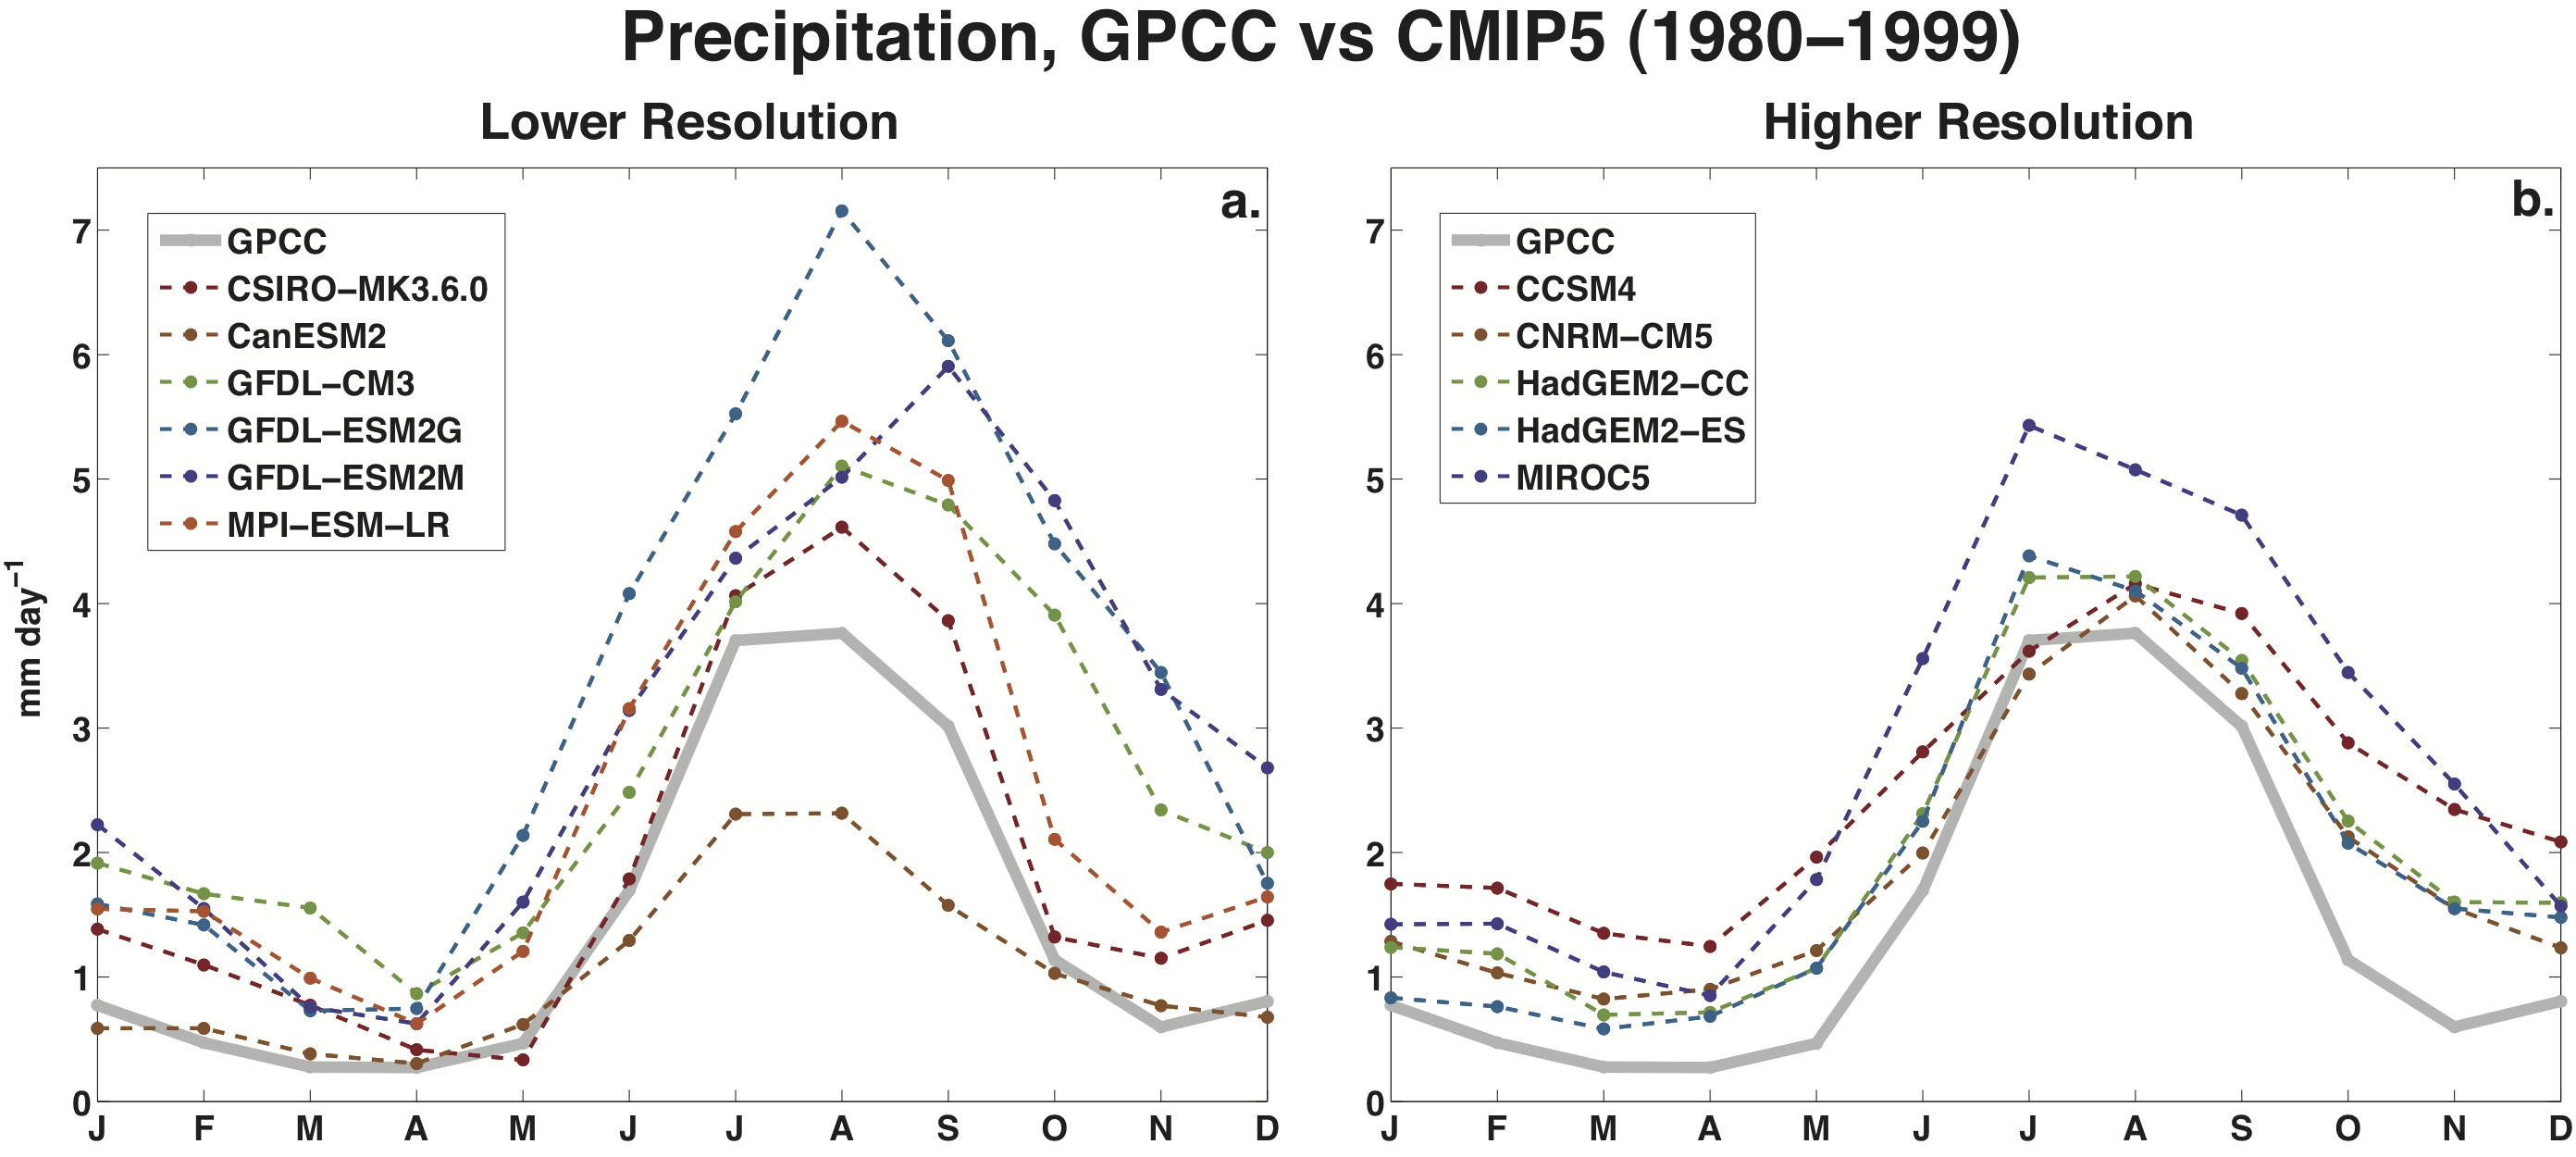
Figure 1 Climatology of the NAM, based on monthly precipitation data from the GPCC. (a) Percent of annual precipitation falling during the peak NAM season (JAS), with the core NAM region outlined by the black dashed line, (b) Climatological monthly precipitation (mm/day) averaged over the core of the NAM region. Figure 1 shows the observed map of the NAM - expressed as % of annual precipitation that falls in July to September (JAS) - and the seasonal cycle of the area-averaged precipitation. The topographic influence and general small scale presents problem for climate models in adequately representing the NAM. First we diagnosed which of the CMIP5 models contain a climatological monsoon of sufficient realism that it is worth assessing how they predict the monsoon will change in the decades ahead. The criteria used were a strong summer precipitation maximum, a dry winter and reasonably rapid onsets and withdrawals of the monsoon. This left us with 11 models. Interestingly the higher spatial resolution models do not perform notably better than the lower resolution ones Figure 2.
Figure 2 Comparison of precipitation climatologies (1980-1999) for the core NAM region in the CMIP5 historical simulations (dashed lines) and the GPCC precipitation data (grey line). Lowest resolution models are shown in (a), highest resolution models are displayed in (b). Where multiple ensemble members were available, the model climatologies represent ensemble averages.
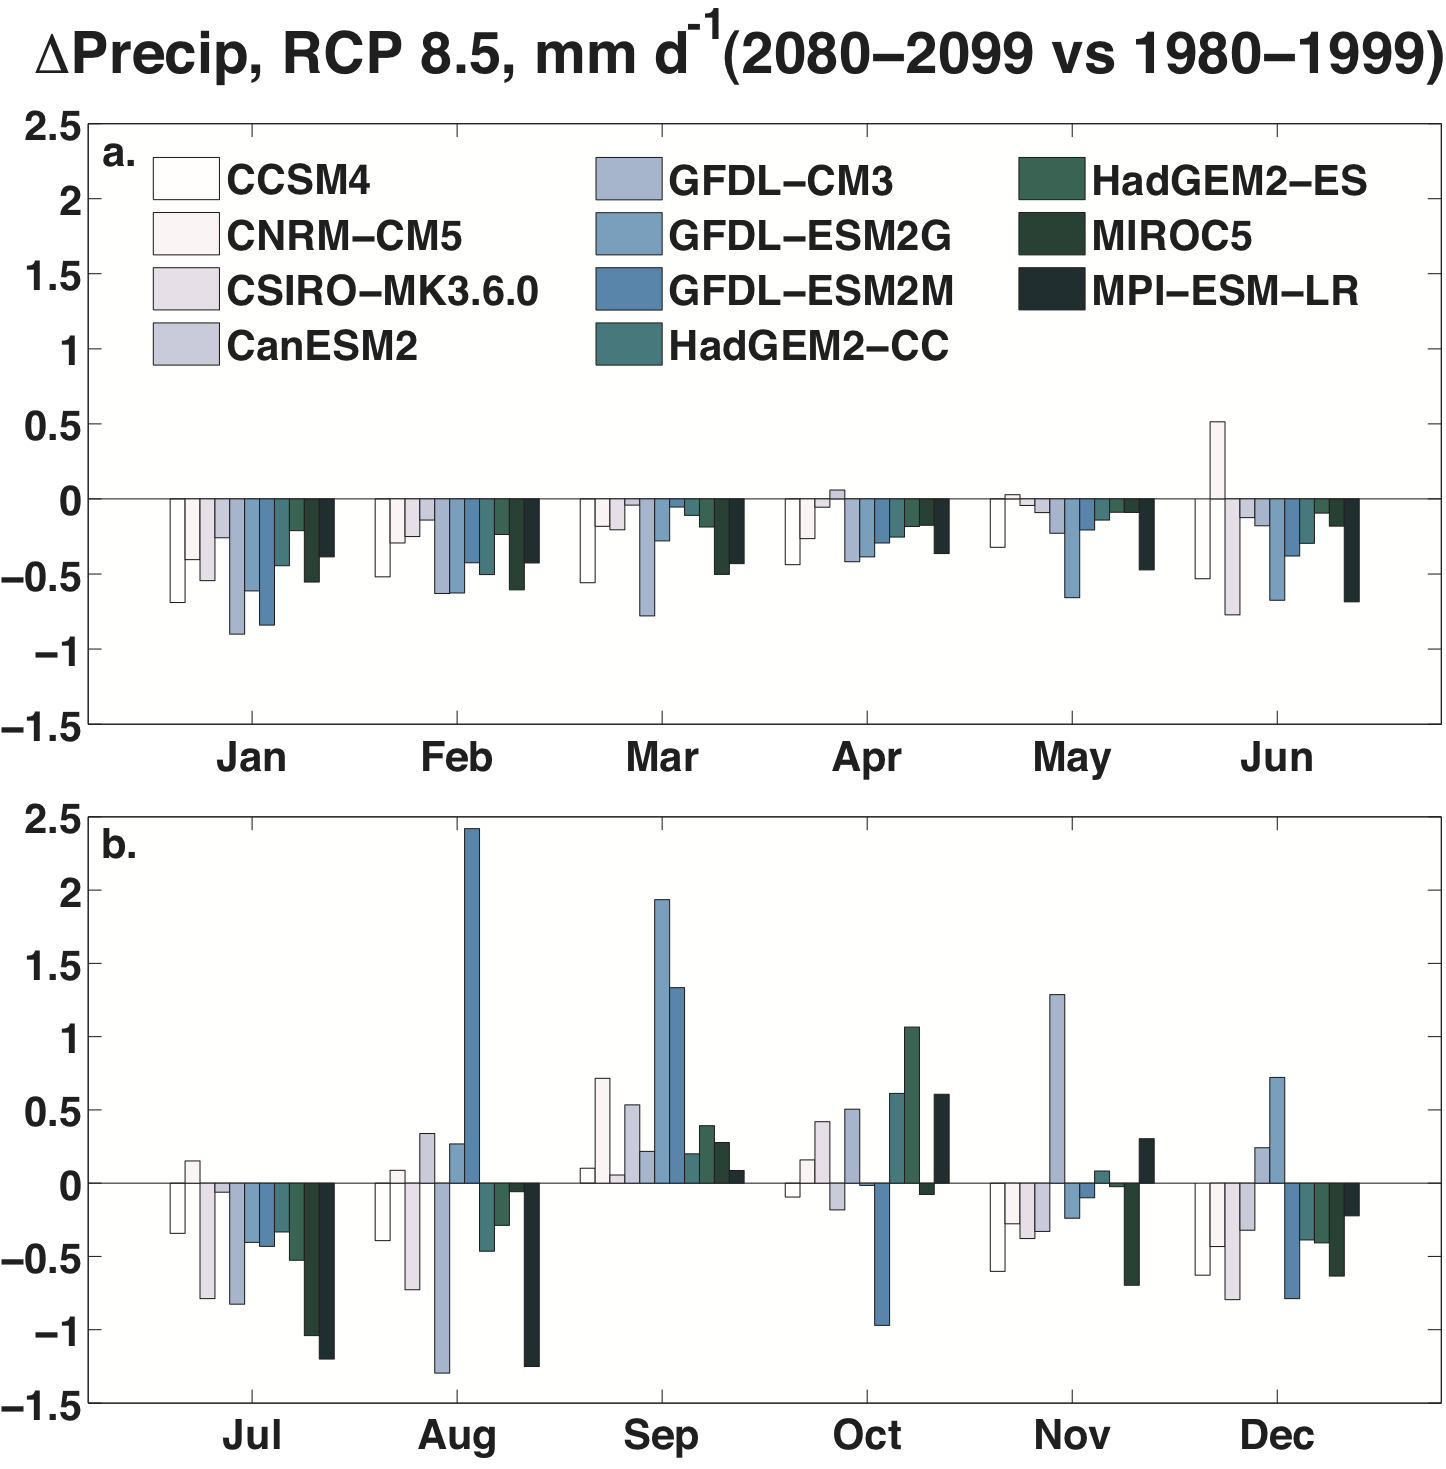
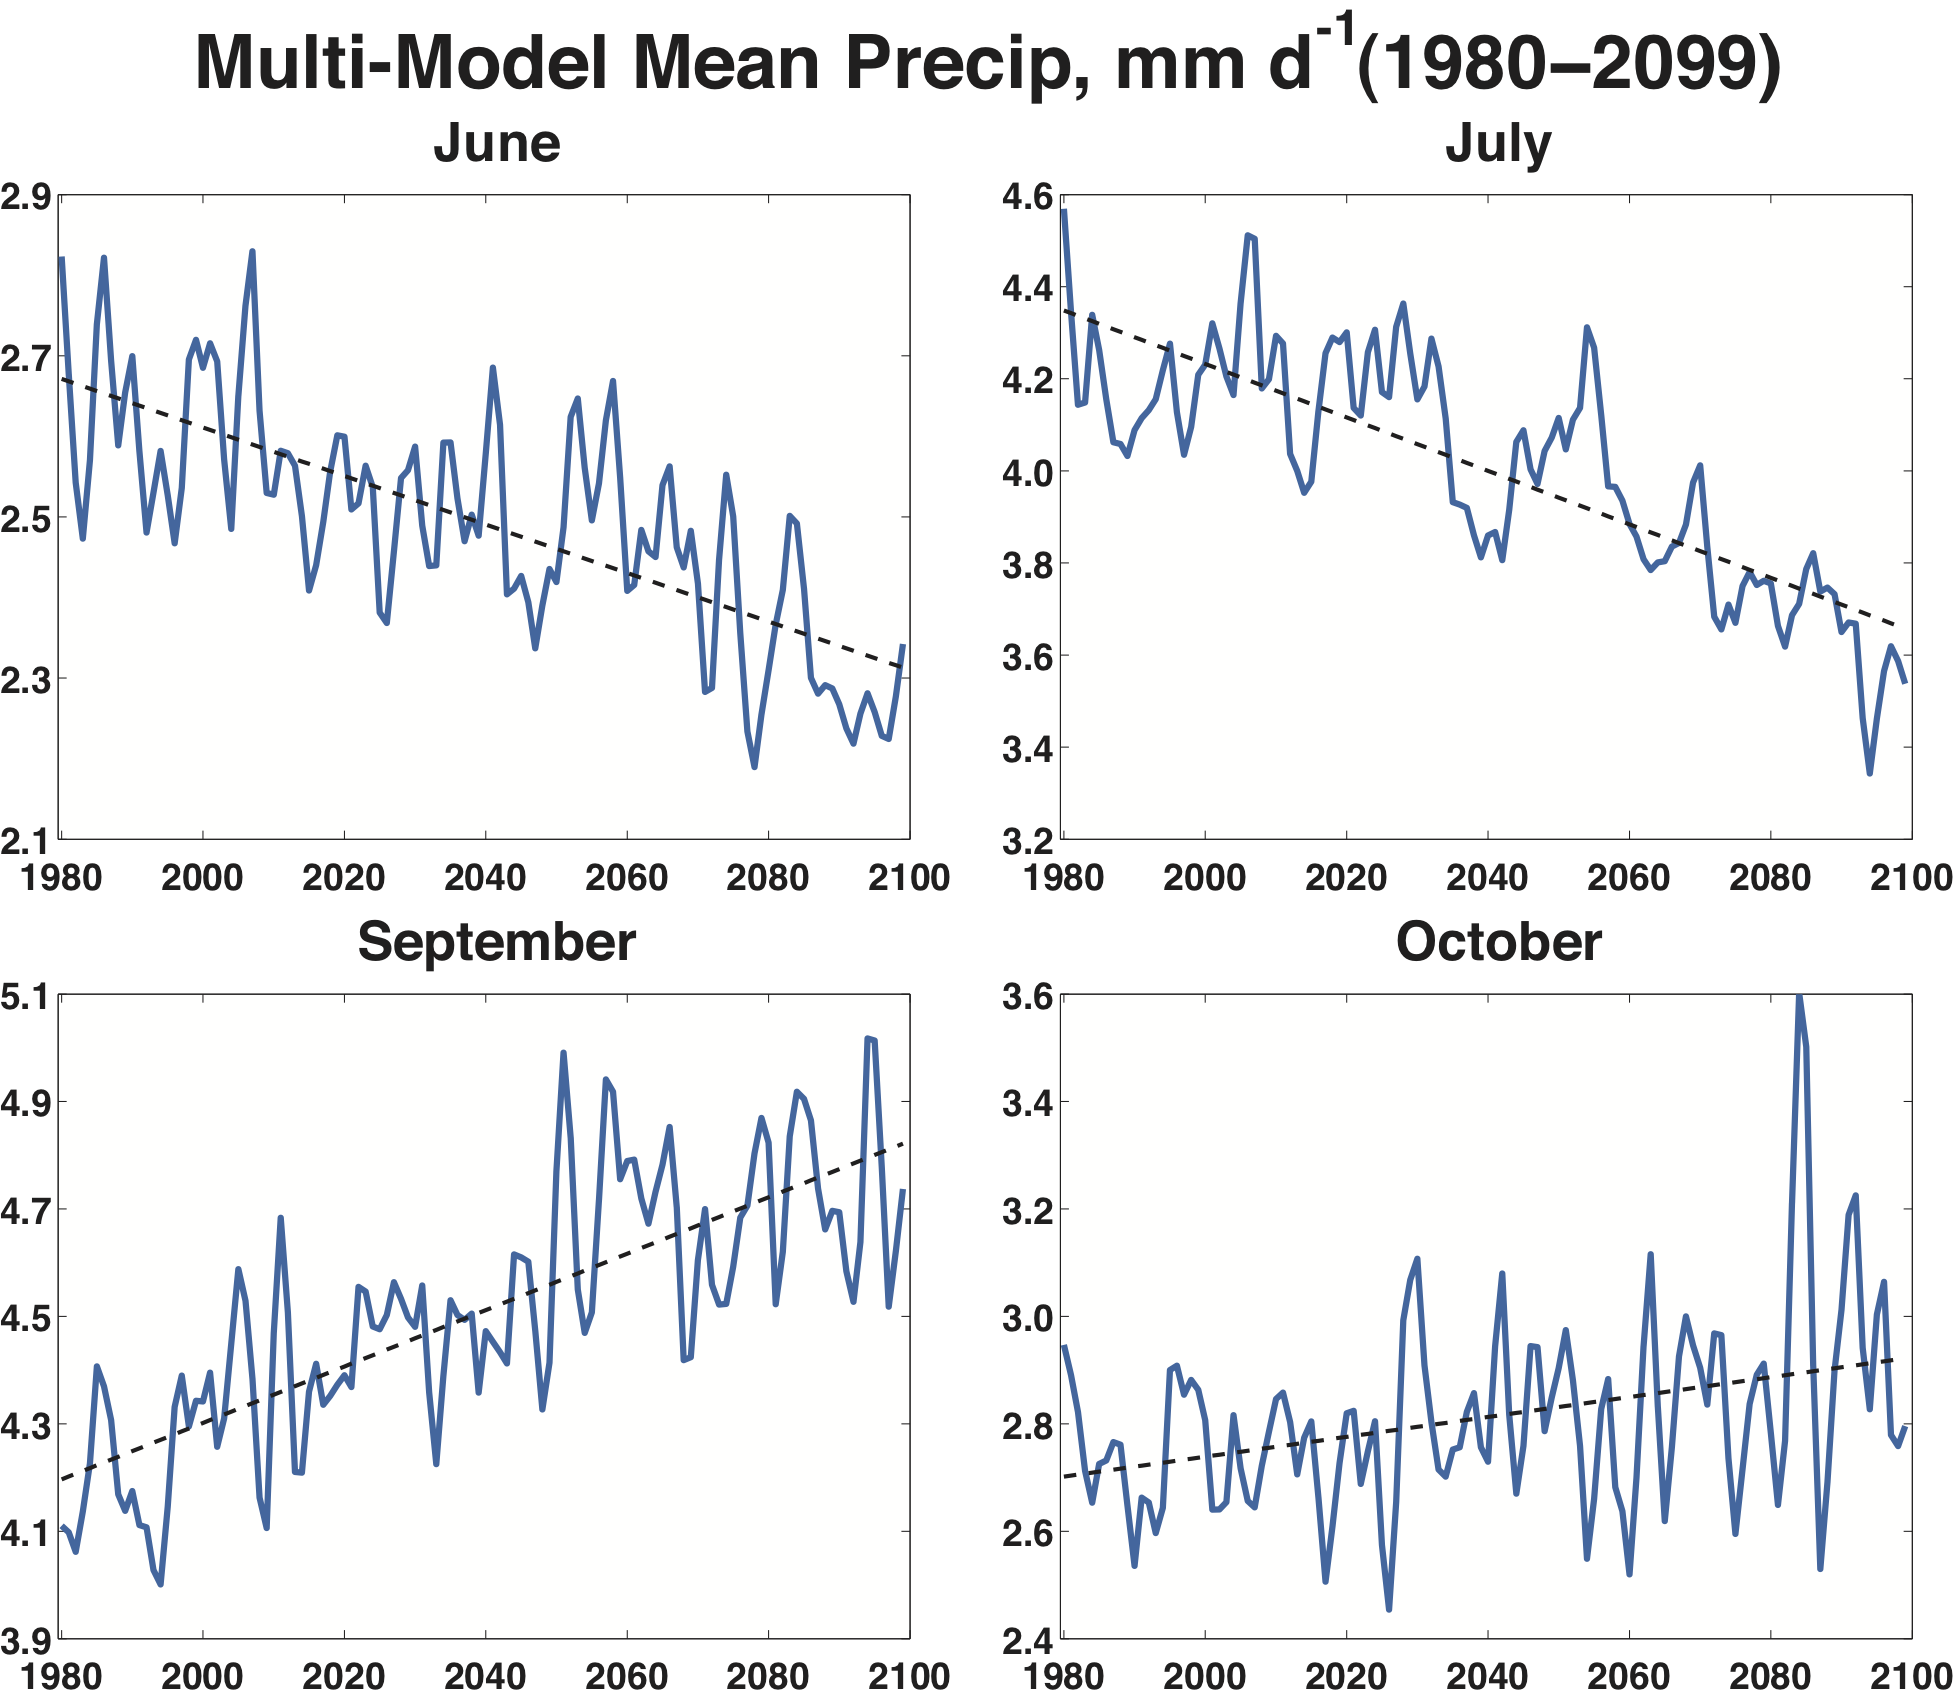
Figure 3 Ensemble average monthly precipitation change (mm/day) for the core NAM region: January through June (a) and July through December (b). Anomalies are calculated as the mean precipitation for 2080-2099 (RCP 8.5 scenario) minus the mean precipitation for 1980-1999 (historical scenario). Figure 3 shows the change in monthly precipitation between the end of the 20th Century and the end of the 21st Century for all of these models. Two things are striking here. First is that the models predict a decrease in monsoon precipitation through July and an increase in September and October, that is, they predict the monsoon will start later and end later. The second striking thing is how much the individual models agree that this change will occur. Because the early decrease and the late increase in precipitation will largely cancel out the total monsoon precipitation is not projected to change by that much. The shift in timing will likely be more important for agriculture and water resources than the change in the total. Figure 4 shows how this change emerges over time in the average across the 11 models and it looks quite linear. In particular if the models are correct we should be expecting to see a shift backwards of the monsoon timing to emerge in the coming years and decade or two.
Figure 4 Changes in NAM precipitation (mm/day) over the core NAM region, averaged across all models for the continuous historical (1980-2005) and RCP 8.5 (2006-2099) scenarios: June (a), July (b), September (c), and October (d). Solid blue lines represent the cross-model mean (smoothed with a 5-year low pass filter). Dashed black lines are the trends estimated from a best fit linear least squares regression for 1980 to 2099.)
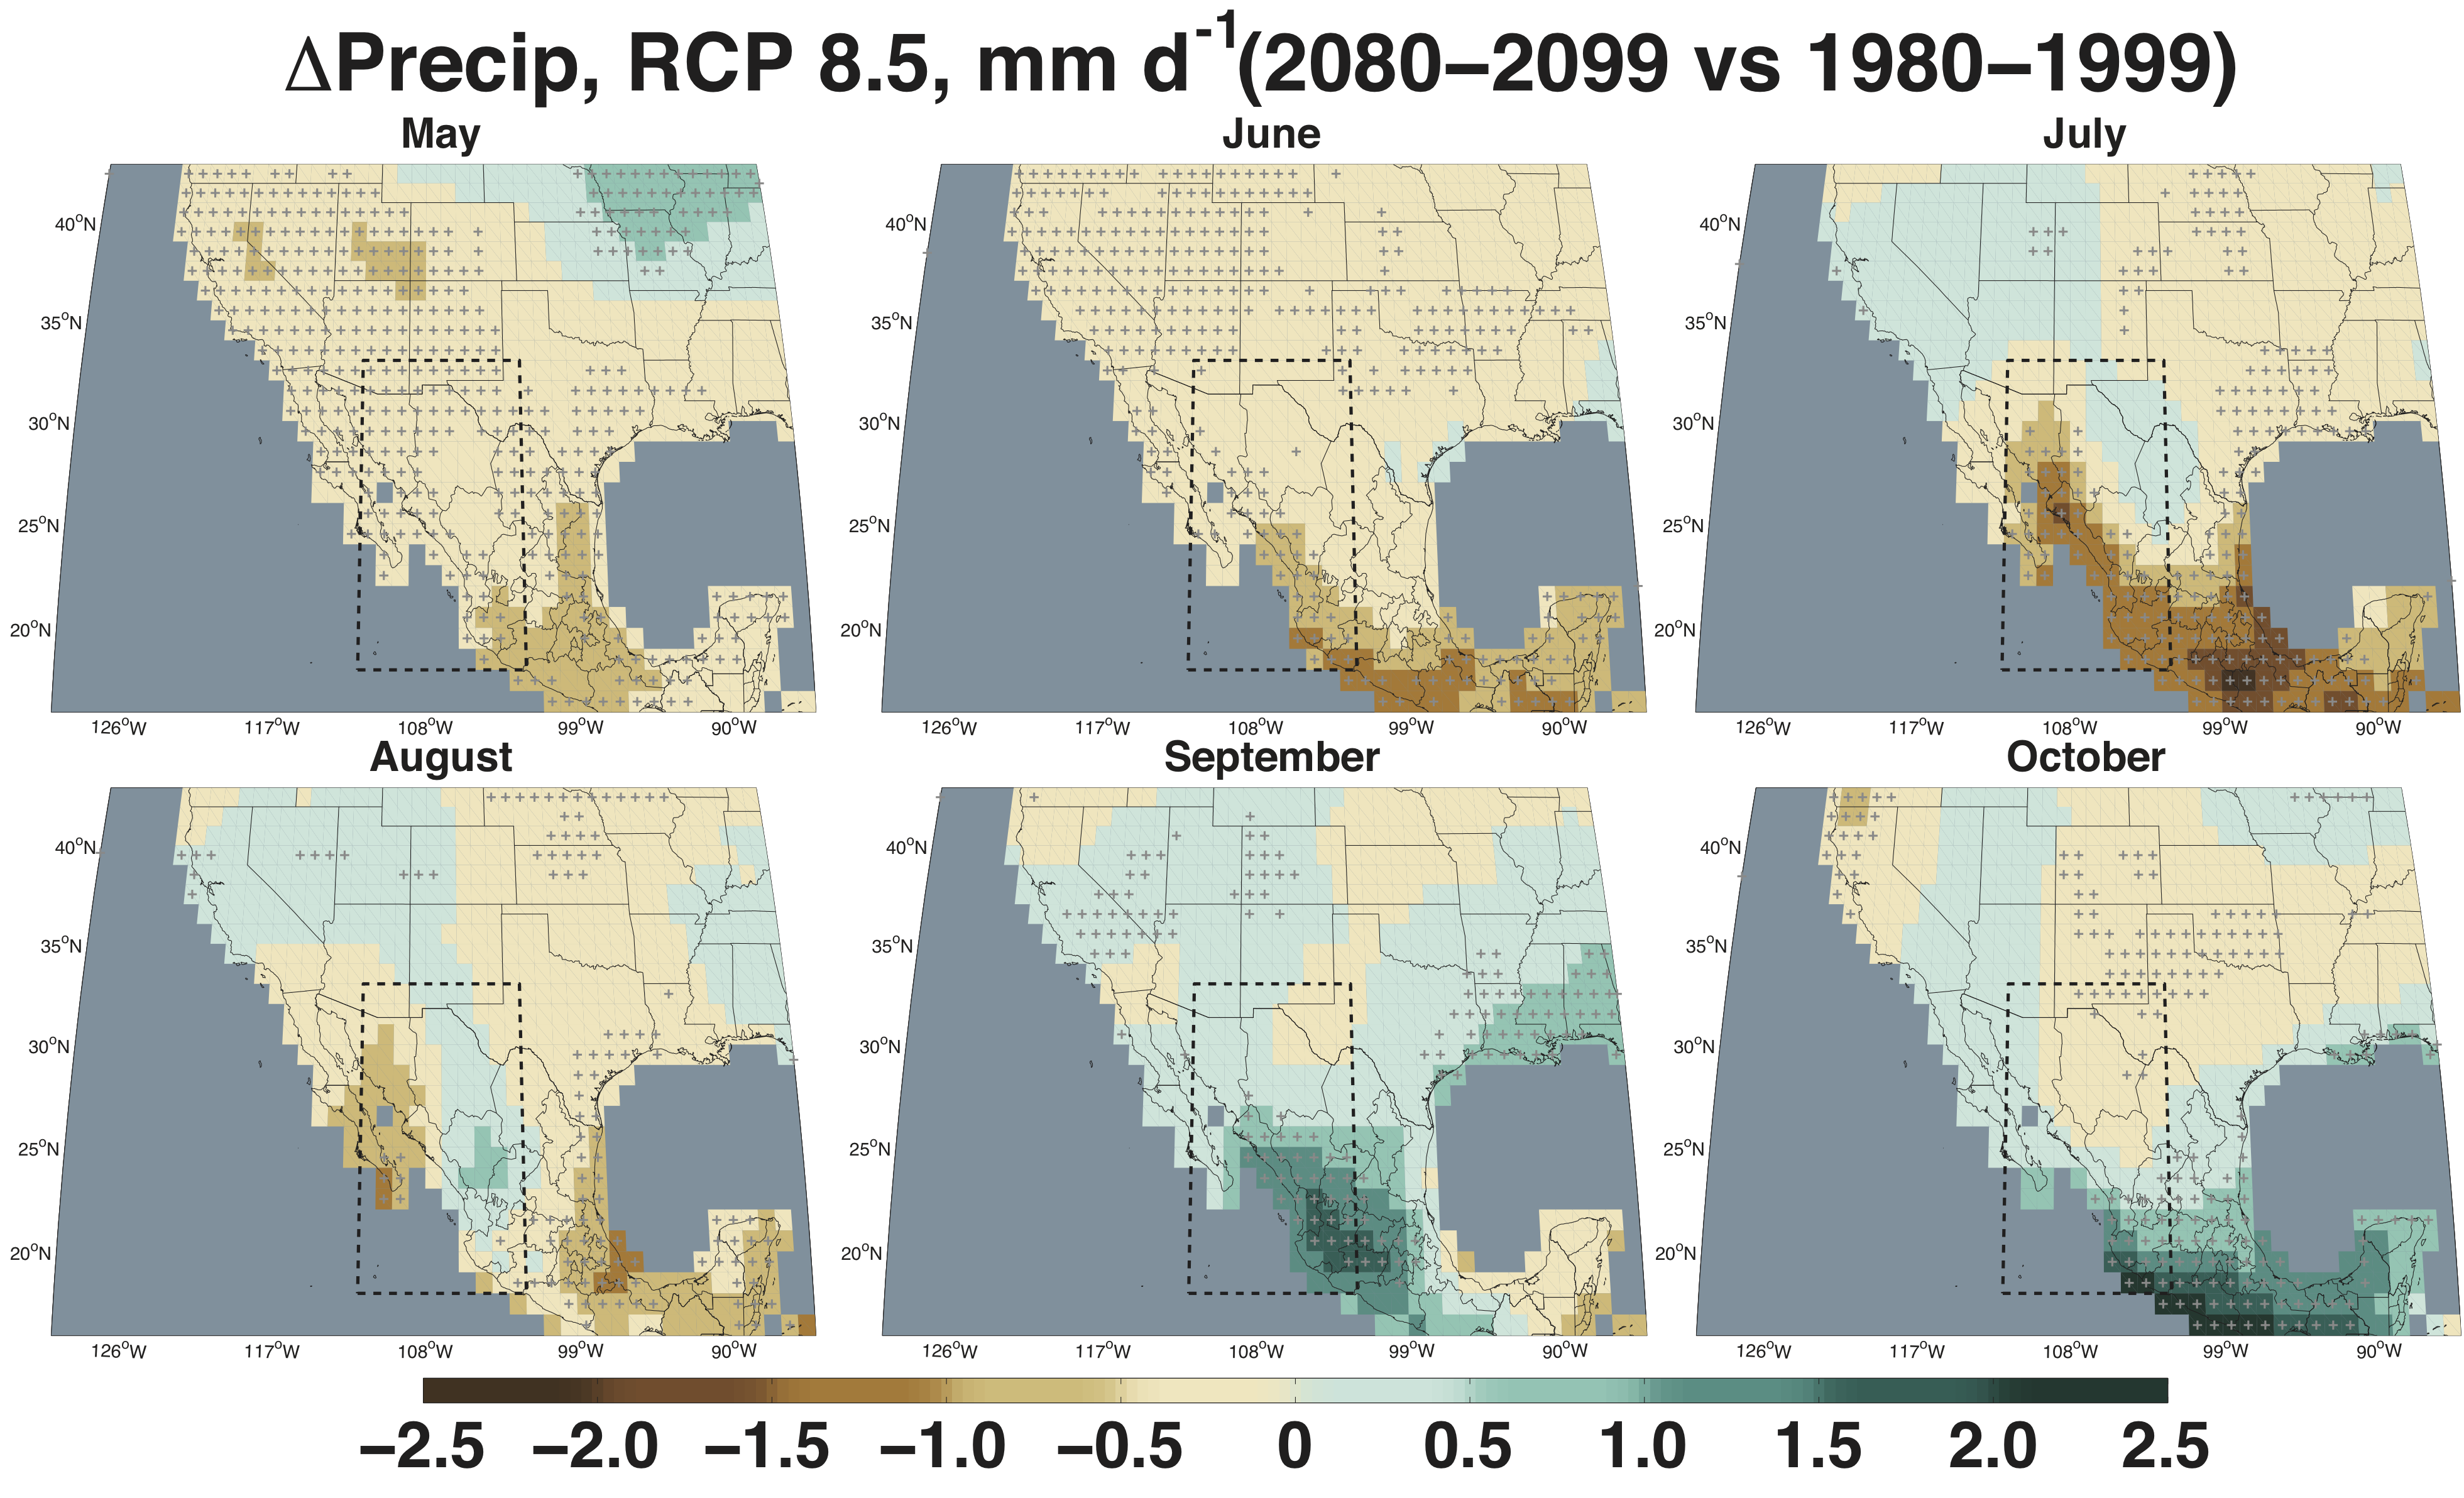
Figure 5 Multi-model mean precipitation differences (mm/day), calculated as mean precipitation for 2080-2099 (RCP 8.5 scenario) minus the mean precipitation for 1980-1999 (historical scenario) for the extended monsoon season (May-October). Core NAM region is outlined with the black dashed lines. Grey crosses indicate cells for which the sign of the change in at least 9 of the 11 models agrees with the sign of the change in the multi-model mean. Figure 5 (which is actually Figure 6 in the paper) shows maps of the mutlimodel mean change in precipitation. The reduced precipitation in April, May and June is very widespread including all of Central America and western and eastern Mexico. The increase in precipitation in September and October is equally widespread. Why does this shift to a later monsoon occur? First of all the NAM region is not unique in this regard. The West African monsoon also shifts towards later in the year as do many aspects of the global climatological seasonal cycle as shown by Biasutti and Sobel (2009). Monsoon rains fall from deep convective systems and hence whether moist convection will occur or not is determined by the moist static instability i.e. whether a parcel of air rising from the boundary layer is buoyant with respect to air above - and continues to rise - or is not and hence rises no further. Buoyant air parcels will cool as they rise and condense out their water making rain possible. So the key to understanding why the model predict the NAM will shift to later in the year is to examine the changes in the moist static stability which depends on the moist static energy of boundary layer air and the saturation moist static energy (purely a function of temperature and pressure) of air in the free troposphere. Figure 6 (which is actually Figure 9 in the paper)
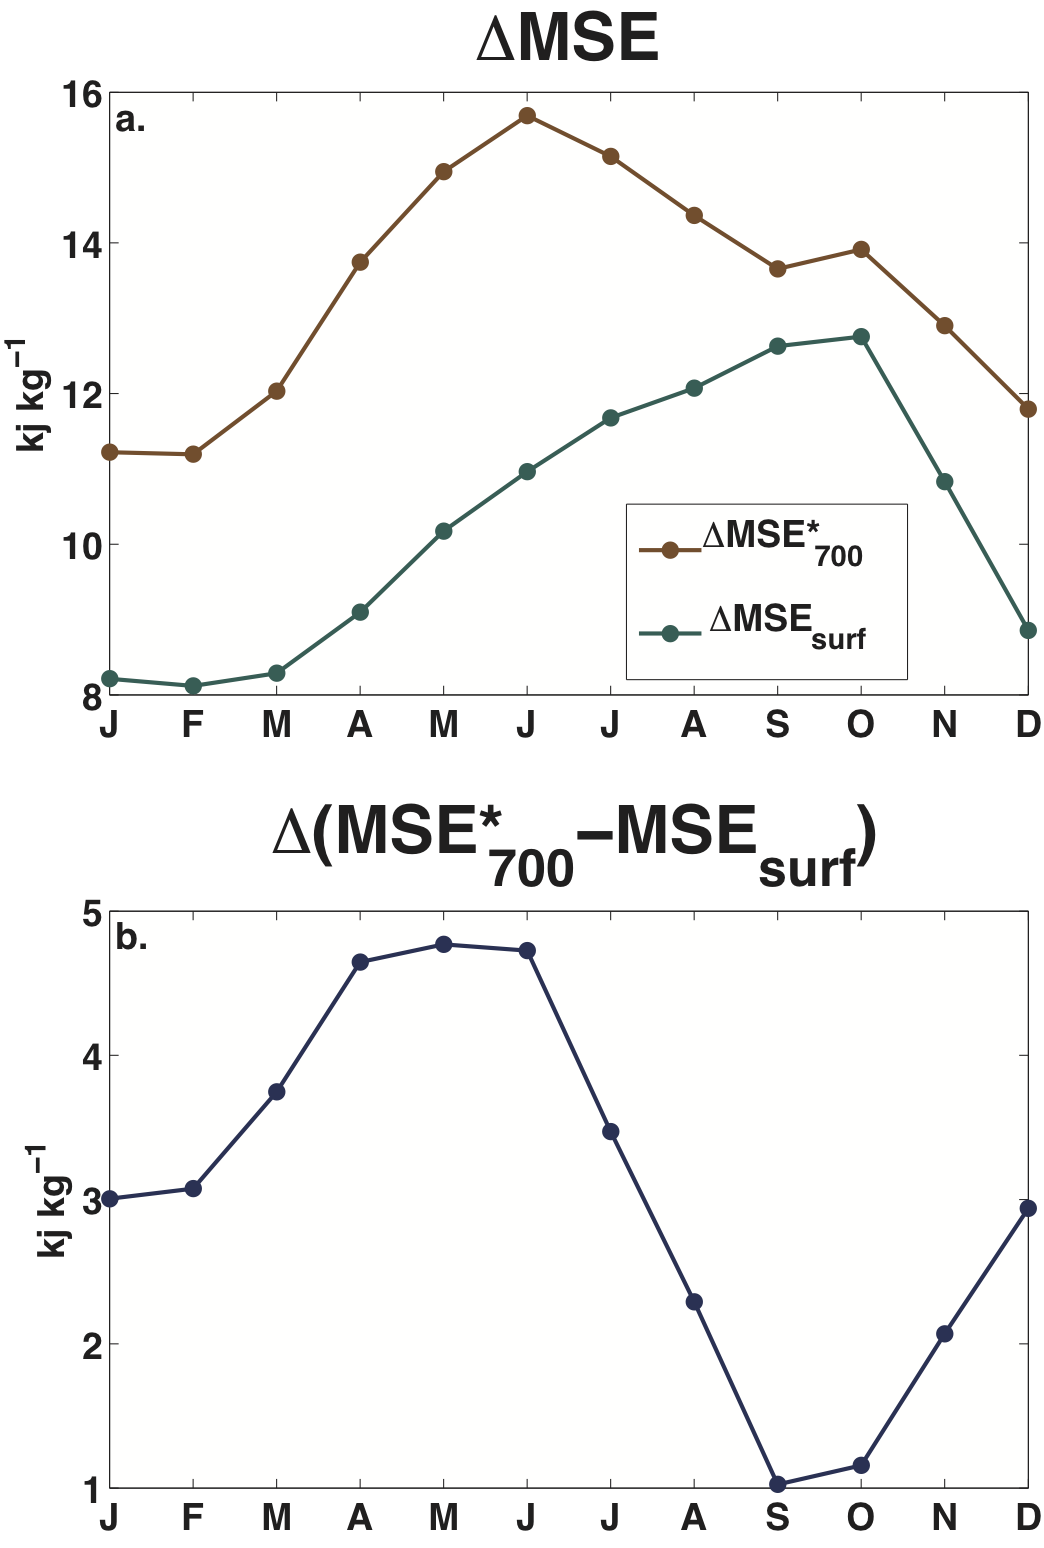
Figure 6 Mult-model mean monthly changes in a) surface moist static energy and 700mb saturation moist static energy, and b) their difference averaged over the core NAM region (kJ/kg). Changes are for 2080-2099 (RCP 8.5 scenario) minus 1980-1999 (historical scenario). Increases in surface moist static energy favor convection and precipitation while increases in 700mb saturation moist static energy act to stabilize the atmosphere, inhibiting convection and precipitation. shows the changes from the 20th the 21st Century of the changes in both and their difference which is a measure of instability or stability to moist convection. The saturation moist static energy at 700mb increases throughout the year which, acting on its own, would tend to suppress convection and it increases by most in June. The surface moist static energy also increases throughout the year, largely driven by the increase in surface specific humidity (not shown) which, acting on its own, would tend to increase convection. The difference is also plotted and show that convection is most suppressed in the late spring and early summer when the surface moist static energy has not increased sufficiently to overcome the increase in saturation moist static energy aloft. By fall the increase in surface moist static energy has increased sufficiently to almost overcome the increase aloft. In the case of the late summer and early fall the area average shown in Figure 6 shows that stability still increases but a look at the regional maps shows that in the core monsoon region there is increased moist static instability as a consequence of a large increase in surface specific humidity which allows the increase in monsoon rains. The general increase in moist static stability is a fundamental effect of greenhouse driven global warming and arises within the tropics from the warming aloft imparted by increased condensational heating as the atmosphere moistens. In latitudes away from the tropics - like those at the poleward limits of the NAM - then mid-latitude dynamics may also play a role in causing increasing stability. This needs to be worked out. However a general increase in stability would be expected to suppress convection in regions away from the deep tropics, such as the NAM, year round so it is not clear why this influence can be overcome in late summer and early fall. It almost appears as if, once surface warming and moistening has allowed the monsoon to begin, it can then maintain itself for a few months! This needs to be examined and determined if it is physically reasonable or whether a more general suppression of the monsoon is also possible. REFERENCES
|