|
Richard Seager, Naomi Naik and Laura Vogel It has become standard issue in coverage of global warming in the media to state that it will result in more droughts and floods and, in general, in more extreme weather and climate. Is it true? First of all, what is exactly meant by 'global warming will cause more droughts and floods'? Does this mean more floods in one place and more droughts somewhere else? Or does this mean more droughts AND floods at all locations? Or does it mean something in between? This matters because, while climate change is a huge problem across the world, already-existing climate variability wreaks havoc on a monthly basis. For many parts of the world why worry about climate change when natural variability already creates floods and droughts that cause mass human suffering and economic damage? Or, to look at the other side of the coin, efforts to build resilience to climate variability will be a good first step to adapting to climate change. But whichever way we look at this we need to know if climate variability will strengthen, weaken or stay the same. More floods in some places and more droughts elsewhere is a distinct possibility. This is because the long term climatological mean spatial distribution of precipitation minus evaporation (P-E, the net flux of water at the surface of the Earth that sustains soil moisture and stream flow) is expected to become more extreme as a result of global warming. This is because a warmer atmosphere holds more moisture and, therefore, moisture transport by the atmospheric circulation strengthens making already wet areas of moisture convergence wetter and already dry areas of moisture divergence drier. So the tropics and mid to high latitudes will get wetter and the subtropics will get drier (see - Mechanisms for Large Scale Changes in the Hydrological Cycle drought research ). This change in the mean would be expected to increase flood risk in the tropics and higher latitudes and increase drought risk in the subtropics. There is no doubt that this is what models project. See for example the case of Southwest North America (on 'Imminent drying' and '21st Century climate of southwest North America').
The change in the mean hydroclimate would therefore increase drought risk in some places and flood risk in other places and this would be so even in the absence of any change in the year-to-year variability of hydroclimate. But there are also reasons to believe that the year-to-year (interannual) variability of hydroclimate will intensify as a result of global warming. Research has shown that differences in P (or P-E) from one year to another across the planet are caused primarily by changes in atmospheric circulation rather than by changes in humidity. Seasons or years that are unusually wet are typically caused by atmospheric circulation anomalies that force persistent ascending motion in the area while for dry seasons or years it is persistent downward subsiding anomalies that are responsible. For example, during El Niño events the remote response of the atmospheric circulation to the warm tropical Pacific sea surface temperature (SST) anomalies forces nearly zonal bands of rising motion in the subtropical to mid-latitude regions of both hemispheres causing increased P-E.
As the atmosphere warms and hold more moisture these same circulation anomalies will be converging or diverging a larger quantity of moisture and, hence, should cause larger P-E anomalies. This is analogous to the reasons why the mean hydroclimate becomes more extreme and also to why, on the timescales of days and hours, precipitation is and will become more intense. On the other hand it is possible that the circulation anomalies that cause the P-E anomalies could either weaken or strengthen as a result of global warming - due to complicating factors of changing SST variability, the changing mean flow through which atmospheric Rossby waves propagate and so on - and this could either intensify, or possibly weaken, interannual hydroclimate variability. In Seager et. al. 2012, published in J. Climate we have looked at this using the 24 models that were assessed by the IPCC Assessment Report 4. First of all we simply examined how the year-to-year variability of P-E in the 21st Century (with the middle of the road A1B emissions scenario) compared to that in the 20th Century (Figure 1). We found that it increased almost everywhere across the globe as expected from the increase in moisture content of the air. Increases were particularly large in the deep tropics and high latitudes but the variability also increased in the subtropical latitudes where the mean climate gets drier. One of the more interesting results though is that in some regions the variability actually weakened, such as over southern North America, the subtropical eastern Pacific Ocean and tropical Atlantic Ocean. One reason for why the variability weakens in some places is that the variability of the vertical velocity weakens except over the equatorial Pacific Ocean and a few polar regions and this would offset the impact of the rising humidity (Figure 2).
The dominant mode of global P-E variability is by far, the El Niño-Southern Oscillation (ENSO) and so we decided to continue by examining that. ENSO was identified in each model as the first mode of an empirical orthogonal function decomposition of the model's annual mean P-E field for, first, the 20th Century and, second, the 21st Century. Results were then averaged across the models. We found that the ENSO-dirven P-E variability strengthens almost everywhere with the exceptions of southern North America and the tropical Atlantic Ocean and northeast Brazil (Figures 3, 4 and 5).
We also broke down the model moisture budgets so that P-E anomalies could be attributed to a part caused by variations in circulation and another part caused by variations in humidity. This confirmed that the models correctly had the ENSO-driven P-E anomalies being caused by circulation anomalies. In going from the 20th to the 21st Century, global warming and atmospheric moistening will cause these circulation anomalies to create larger P-E anomalies. To check this we broke down the change in the part of the P-E anomalies caused by circulation anomalies into components due to the 20th to 21st century change in humidity and due to changes in the circulation variability. The change in the circulation term due to rising humidity does indeed simply intensify the interannual ENSO-driven P-E variability. However the change in the circulation variability itself is just as important, and in some regions of the world more important, for changing the P-E variabilty than the change in mean humidity. Changes in the circulation variability cause the change in P-E variability over the Atlantic Ocean and are responsible for the P-E variability not strengthening over southern North America (paper Figure 8).
In summary, according to the climate models, interannual hydroclimate variability does intensify as climate warms - departures from the normal for dry years will get drier and for wet years will get wetter. At the same time the 'normal' will be shifting with wet areas getting wetter and dry areas getting drier. However changes to the predictable part of the interannual hydroclimate variability, that driven by ENSO, are not so simple. Because ENSO-driven circulation variability alters some parts of the world (such as the Asian monsoon region) are projected to experience stronger year-to-year variability while others (such as southern North America) experience little change and others (such as northeast Brazil) are projected to have weaker variability. We ned to move on to understand why the ENSO-driven circulation variability changes the way it does as global warming progresses. REFERENCES
|


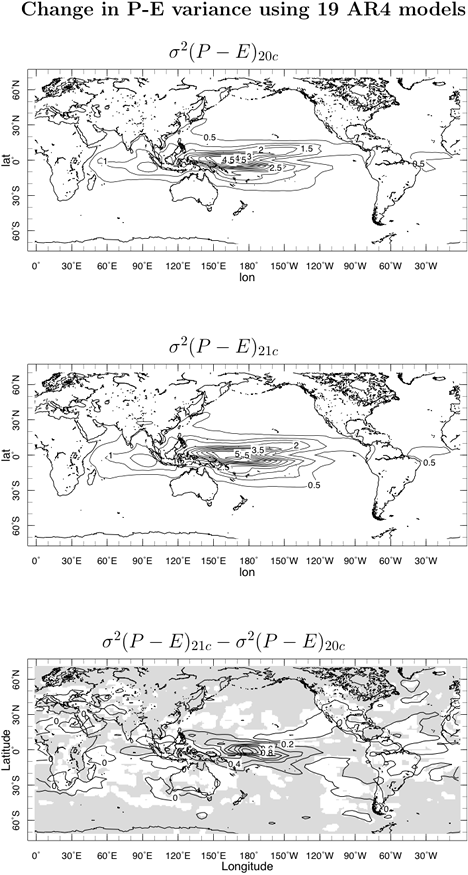 Fig. 1. The variance of annual mean P −E for the 20th Century (top), 21st Century (middle) and the difference (bottom) evaluated for each model and then averaged across the multi- model ensemble. Shading in the lower panel indicates significance at the 95% level. Units are mm/day squared.
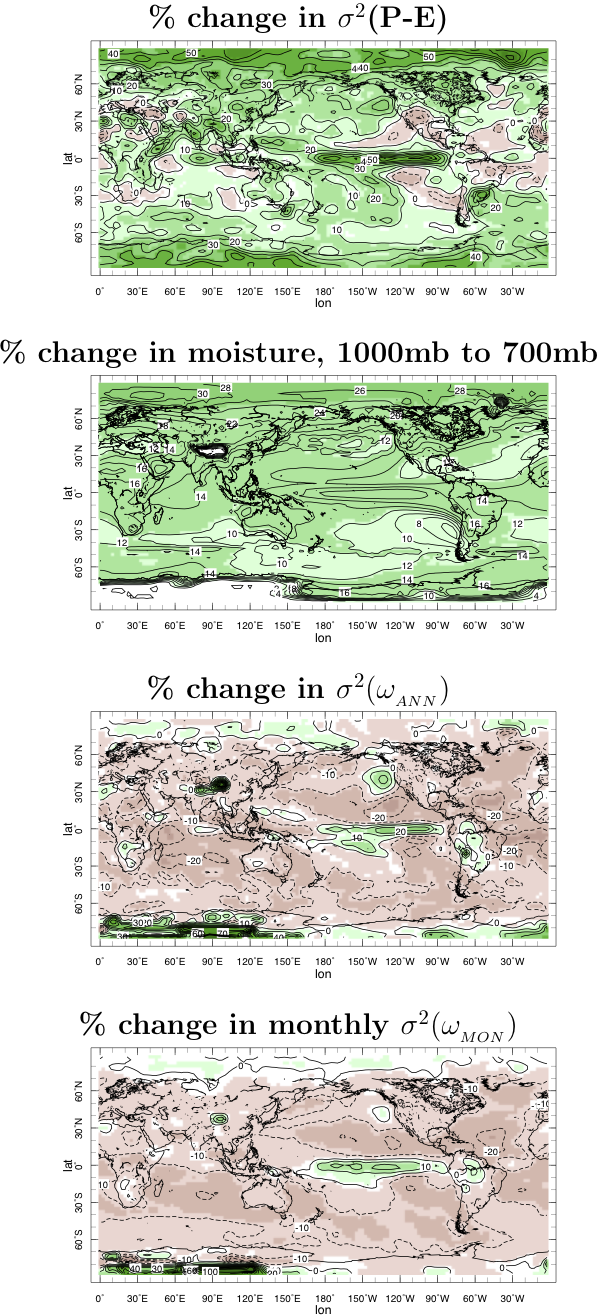
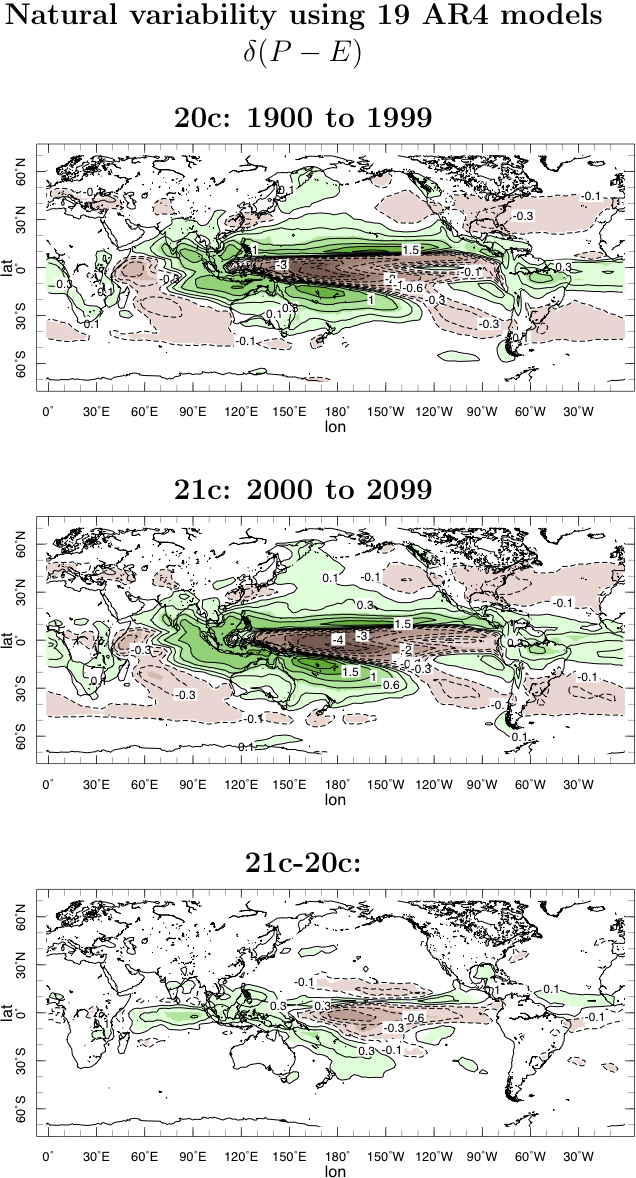
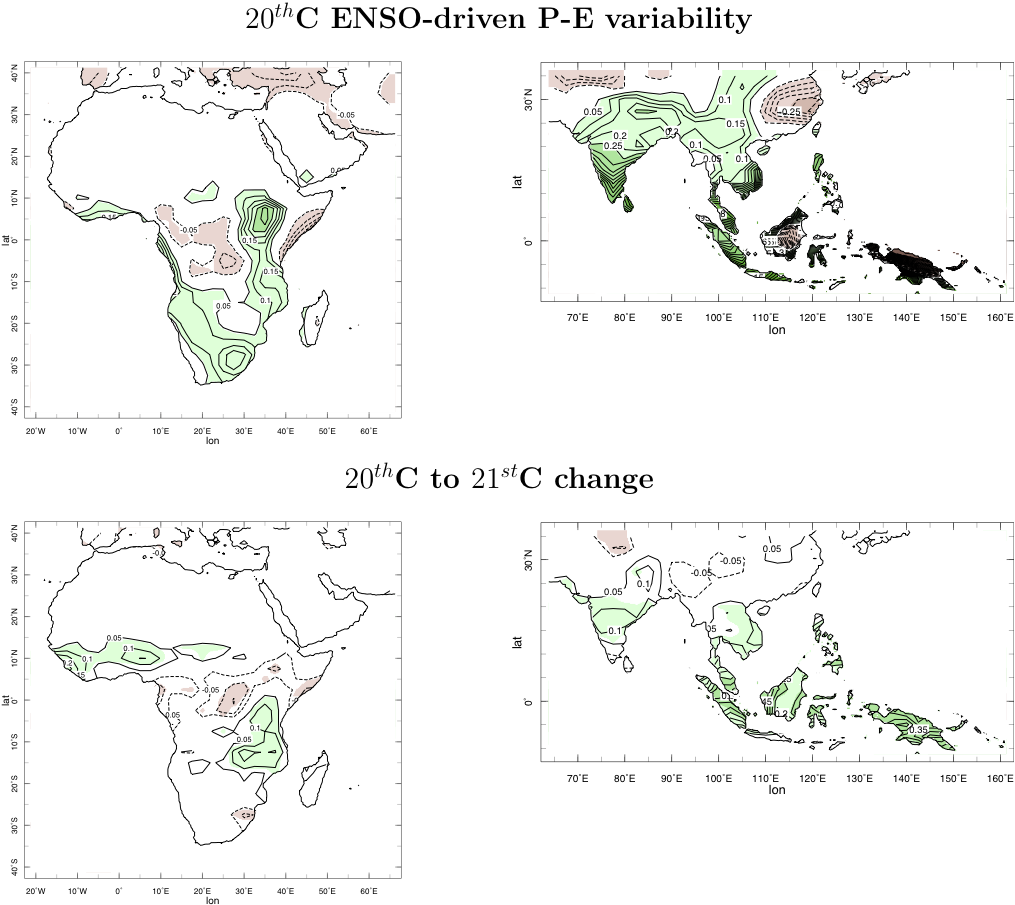 Fig. 4. As in Figure 3 but shown just for Africa and south Asia. Only regions where the difference is significant at the 95% level are colored.
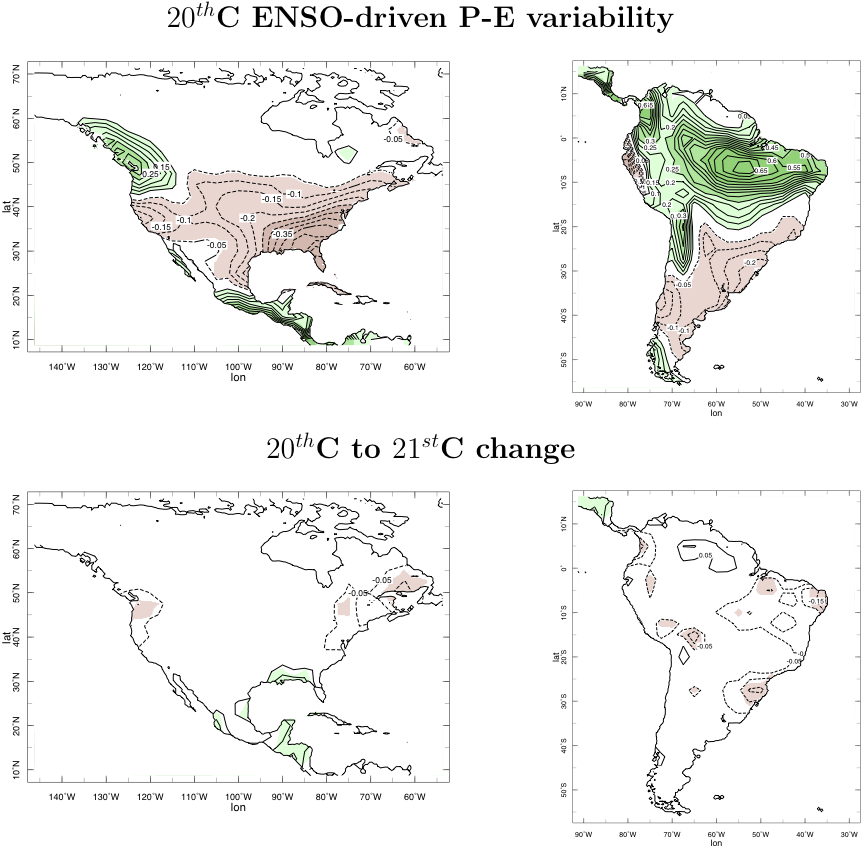 Fig. 5. As in Figure 3 but shown just for North and South America. Only regions where the difference is significant at the 95% level are colored.
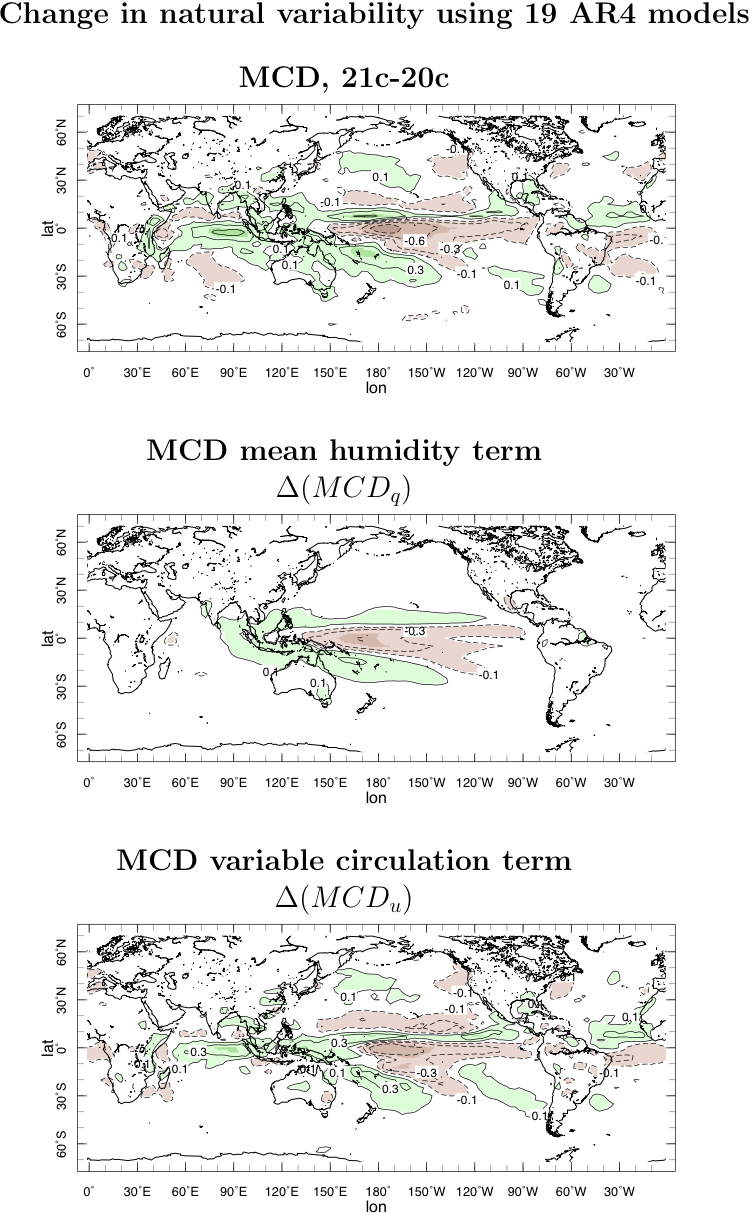 Fig. 8. The 21st minus 20th Century change in the La Niñ̃a minus El Niño composite of the mean circulation dynamics (δMCD) contribution to P − E variability for the multi-model ensemble and the contributions to it from the change in mean specific humidity (middle) and the change in circulation variability (bottom). Units are mm/day.