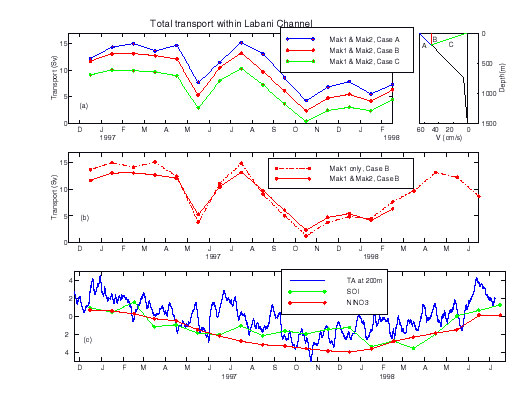
Fig. 4 Total southward or throughflow transport within Makassar Strait (displayed as positive values) for each month (Fig. 4a,b). As the data from the moored ADCP (deployed at 150 m) is still being processed (see text) we use three models for carrying the Aanderaa along channel speeds to the sea surface (insert adjacent to 4a). As mentioned in the text, we favor Case B, which on average differs from A and C results by 2.4 Sv, about 25% difference. Transport determined from use of both moorings for the period up to February 1998, agrees closely with the use of only MAK-1 (4b), suggesting that one mooring may be sufficient in monitoring Makassar transport. The temperature recorded by the 200 m instrument of MAK-1 was processes to remove the mean vertical temperature gradient, recorded during the strong semi-diurnal blowover movements. An anomaly of temperature was then calculated, the difference between the temperature change expected from the mean temperature profile from that actually recorded. The temperature anomaly (Fig. 4c) compares favorable to the ENSO indicators of SOI and the SST anomaly at El Niño-3. The thermocline is deeper during La Niña, shallower during El Niño, as also shown in Figure 2; thermocline depth is correlated with transport magnitude.