Goals
-
Monitor the spring freshet pulse of suspended particles down the Hudson
-
Observe currents at high resolution and frequency to understand turbulent mixing
Deployments
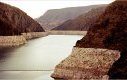
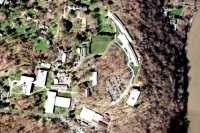
Tripods were deployed on the bed of the Hudson River and estuary at sites shown in
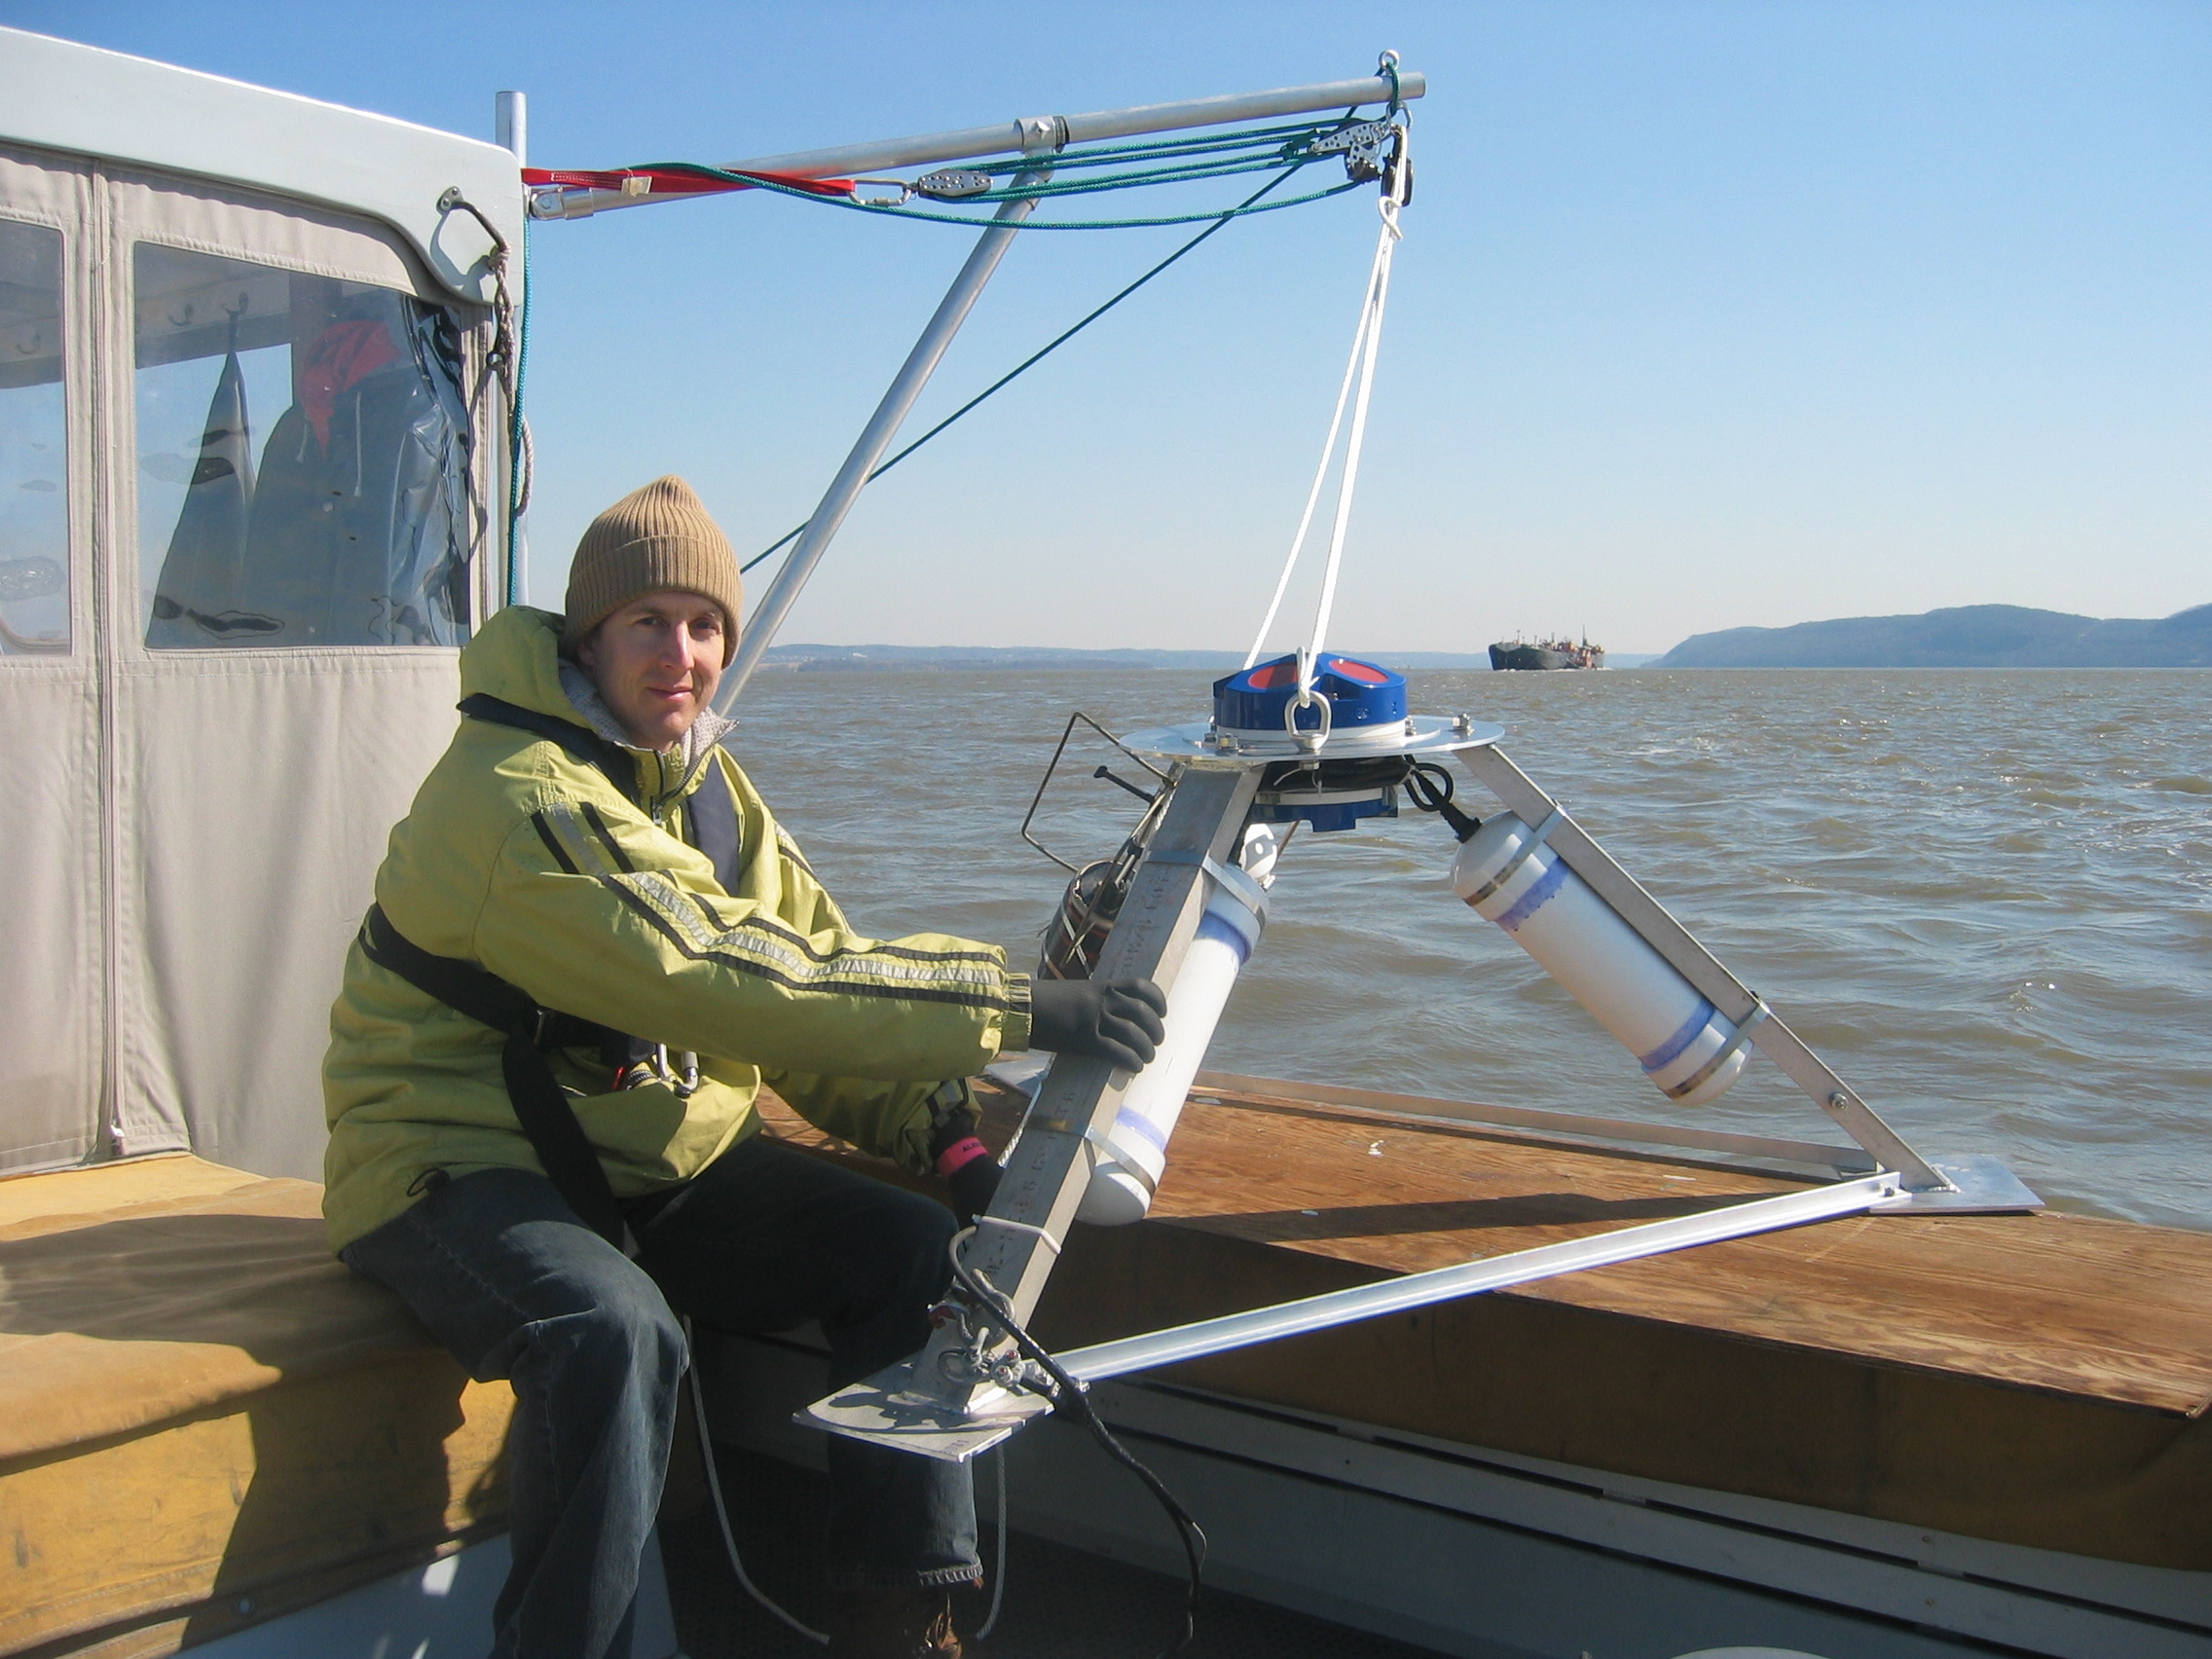
Figure 1. Tripods held an
RD Instruments Acoustic Doppler Current Profiler (Workhorse Monitor, 1200kHz) facing upward to monitor currents and acoustic backscatter through the water column (
Figure 2). A CTD was typically either attached to the tripod or vertically profiled continuously throughout each deployment to measure salinity, temperature and depth. Two 100-day spring 2004 deployments (Piermont and Haverstraw) were funded by the Environmental Protection Agency. The spring 2004 Piermont tripod also held a Wetlabs FLNTU-B fluorometer and optical backscatter sensor, for monitoring chlorophyll concentrations and turbidity.
Table 1: Hudson tripod deployments. All deployments are part of the Riverscope Pilot Program.
Code
|
Dates
|
Latitude
|
Hudson
Deployment Location
|
Depth
(m)
|
Δt (s)
|
Δz (m)
|
λ (kHz)
|
a
|
05/21/02 -
05/28/02
|
40º
53.35' |
N. of George
Washington Bridge
|
11
|
1
|
0.5 |
1200
|
b
|
07/22/03 -
07/31/03
|
41º
47.4'
|
near
Kingston, NY
|
14
|
1
|
0.5 |
1200
|
c
|
11/24/03 -
12/03/03
|
41º 2.8'
|
off Piermont
Pier, Piermont, NY
|
7
|
1
|
0.5 |
1200
|
d
|
03/25/04 -
05/07/04
|
41º
2.85'
|
off Piermont
Pier, deep channel |
14.5
|
2
|
0.5 |
1200
|
e
|
03/24/04 - 05/07/04
|
41º
13.98'
|
upper
Haverstraw Bay, deep channel |
14.5
|
2
|
0.5 |
1200
|
f
|
05/13/04 -
07/12/04
|
41º
2.85' |
off Piermont Pier, deep channel
|
14.5
|
2
|
0.5 |
1200
|
g
|
05/12/04 -
07/03/04
|
41º
13.98' |
upper Haverstraw Bay, deep channel
|
14.5
|
2
|
0.5 |
1200
|
Observations
Acoustic Doppler current profilers (ADCPs) non-intrusively provide high-resolution vertical profiles of three-dimensional current velocity, as well as acoustic backscatter (ABS). Acoustic backscatter is a convenient proxy measurement for suspended sediment mass concentration (SSC). In collaboration with the United States Geological Survey's Lower Hudson River Discharge and Sediment Flux Project, we are calibrating the ABS data and will post figures summarizing sediment transport in terms of mass. For the time being, the data are presented as ABS (see Figure 3 links below), which is logarithmically related to SSC.
ADCPs may also be used to measure Reynolds stress (τxz, τyz) using the "variance method" (Stacey et al, 1999; Lu and Lueck, 1999). We also calculated turbulent kinetic energy production (P) and eddy viscosity (Az) from observations of τxz, τyz and the mean velocity shear. For some of the deployments, vertical density profiles are available, which will allow us to estimate the eddy diffusivity (Kρ). Other deployments have simultaneous dye tracer experiments, which will allow us to compare estimates of Kρ to the diffusivity for the dye.
Monthly 150-mile
upriver CTD sections, from the near the mouth of the Hudson (The Battery) to Troy, NY, are also available online as part of the Riverscope project.
Figure 3 (see table above for details on each letter -
a,
b,
c,
d,
e,
f,
g )
: Summary figure showing observations over the duration of each deployment: along-channel velocity (u), along-channel veritical shear (du/dz), range-corrected acoustic backscatter (ABS), the along-channel vertical component of Reynolds stress (τ
xz), vertical eddy viscosity (A
z), and turbulent kinetic energy production (P). For Reynolds stress estimation, a vertical cosine filter (with half-length ~1/4 the total depth) was used to remove beam velocity fluctuations with a large vertical scale. This ensures that velocity fluctuations due to surface and internal waves do not contaminate the measurements (Orton and Visbeck, in preparation).
Figure 4: Accompanying observations for the first spring 2004 deployment off Piermont Pier: An estimate of Hudson River freshwater inflow as the sum of the two major tributaries, then salinity, temperature, turbidity, chlorophyll-a (chl) and pressure (Pressure in dbar is similar to water depth in meters) at 0.5 m above the river bed, and acoustic backscatter at a height of 2.3 m. Hudson River flow at Green Island should be available by summer 2005.
Figure 5: Accompanying observations for the second spring 2004 deployment off Piermont Pier: freshwater inflow, salinity, temperature and pressure (Pressure in dbar is similar to water depth in meters) at 0.5 m above the river bed.
Figure 6:
Net river outflow past Poughkeepsie, bottom depth and salinity at the tripod (0.5 m above the bed), and a "surface salinity" estimate taken from the USGS Hastings-on-Hudson site 150 ft from the west bank and 6.5 km seaward (latitude 40°59'16"; 10 ft below mean sea level depth). The bulk gradient Richardson number (Ri) is a measure of the vertical stability of the water column, essentially the ratio of stratification-to-shear. We estimated Ri using the full water column density gradient and the vertical mean squared vertical velocity gradient (computed at 0.5 m resolution). For values below ~0.25, vertical mixing is likely, and for values above ~0.25, the converse is true.
References
Stacey, M.T., Monismith, S.G., and Burau, J.R., 1999. Measurements of Reynolds stress profiles in unstratified tidal flow. Journal of Geophysical Research, 104 (C5): 10933-10949.
Lu, Y. and Lueck, R.G., 1999. Using a broadband ADCP in a tidal channel, part II: Turbulence. Journal of Atmospheric and Oceanic Technology, 16: 1568-1579.
