Richard Seager, Yochanan Kushnir, Neil Pederson, Jennifer Nakamura and Stephanie Jurburg

|
|
|
The New York City water supply system is a wonder. It supplies 9 million people with superb quality water relying on a series of reservoirs, dams and aquifers that are incredible works of engineering - and often the first of their kind at the time of construction - and which link the City to the Catskill Mountains. The water flows under gravity to many New York City users, other than those in the higher buildings and atop hills, to be stored in the rocketship-like wooden water tanks that are iconic of City skylines. Even more impressive is that the water is unfiltered. Instead the system relies on natural filtering by the ecosystem and reservoirs within the watershed. The City has gone to considerable effort to ensure water quality and the safe operating of the natural filtering through the purchase of Catskills land and active involvement and collaboration in the management of privately held land. The success of this project has saved the City the multibillion dollar cost of building a filtration plant to filter Catskills water. New York City's watershed has become a poster child of natural capital and ecosystem services. (This success makes one wonder why the City does not advertise its water as if it's Poland Spring water or whatever - we have a suggestion (see illustration on right)!).
Despite this stellar record of success there are reasons for concern about the long term sustainability of the water supply system. One comes from the documented increase in extreme heavy precipitation which is occurring across the globe and arises from the ability of a warming atmosphere to hold more moisture. Heavy rain can lead to excessive surface runoff and wash organic matter into the reservoirs. This has been a problem for a while now. Further, since its completion in the 1960s, the water supply system has operated during a multidecadal period that has been surprisingly wet. The last truly severe drought was in the early to mid 1960s. Nonetheless water emergencies have arisen in recent decades which makes one wonder what would happen if a drought like the 1960s one was to return or if the long-term wetting trend were to reverse. In addition, reduced winter snowfall in the Catskills reduces the natural storage of water in the watershed and can pose problems as winter inflows to reservoirs increase well ahead of the peak season for water use. Also warming increases evaporative demand and evapotranspiration and is expected to reduce water flow into the reservoirs even if precipitation remains unchanged.
|
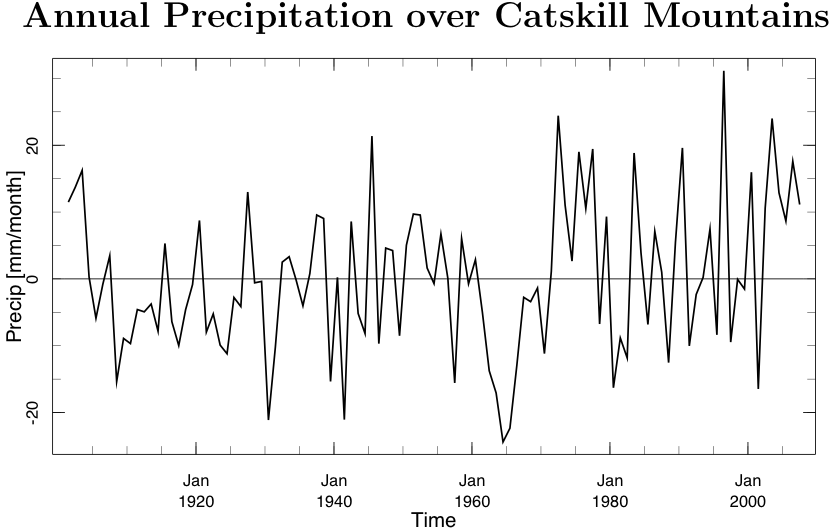
| Fig. 1. The annual mean precipitation anomaly relative to the long term mean for the Catskill Mountains and surrounding areas (41◦N − 43◦N, 76◦W − 73.5◦W ) from the GPCC gridded data. Units are mm/month. |
We have conducted an analysis of one part of this problem: Explaining the century long precipitation history in the Catskill Mountains, Seager et al, 2012. Our focus is to examine the causes of the early to mid 1960s drought and the subsequent wet period ('pluvial'). In doing so we assess if these were related to slow variations of sea surface temperatures (SSTs) and, hence, are potentially predictable if the SSTs can be predicted. For example, drought prediction on the seasonal to interannual timescale is possible (to some extent) in the southwest and southern Plains regions based on prediction of tropical Pacific and Atlantic SSTs. (It turns out that is not the case for the Catskills. ) We also want to assess if the wetting trend is in anyway related to global warming and hence might be expected to continue. (We find that it is not.)
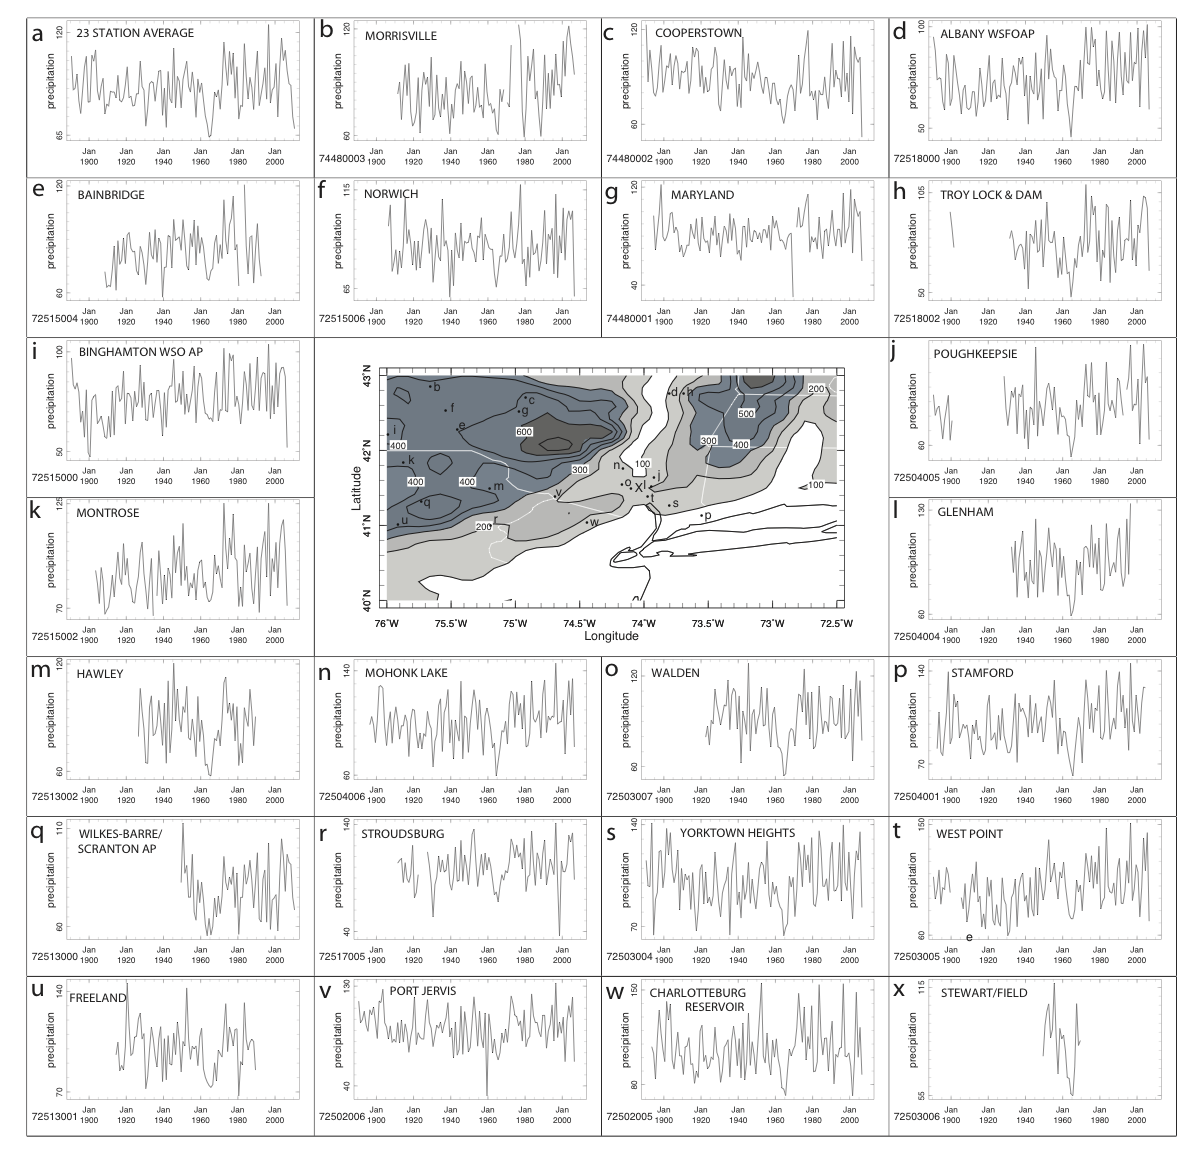
The problem at hand is illustrated in Figure 1 which shows the area average annual mean precipitation (from the gridded GPCC data set) in an area that encompasses the Catskills. The 1960s drought is truly striking and the pluvial after it is also quite amazing. In the paper we show that the 1960s drought was a year-round event but strongest in the spring while the long term wetting was most obvious in the spring and fall seasons. A more detailed look is shown in Figure 2 (Figure 3 from the paper) which shows precipitation records from weather stations (from the GHCN data), their location and a 23 station average. The 1960s drought appears in all. The pluvial is more obvious in some stations (e.g. Albany) than others (e.g. Port Jervis) while others show a century long wetting trend (e.g. West Point) but the station average shows a clear drought and pluvial.
|
| Fig. 2. Total annual mean precipitation records from weather stations contained within the greater Catskills region. Only stations within the region are plotted with locations shown on the topographic map. Station data are from the Global Historical Climatology Network.The upper left graph shows the average of the 23 stations. This can be compared to the regional average of the GPCC gridded data plotted in Figures 1 and 2. State borders are plotted as white lines. Units are mm/month. |
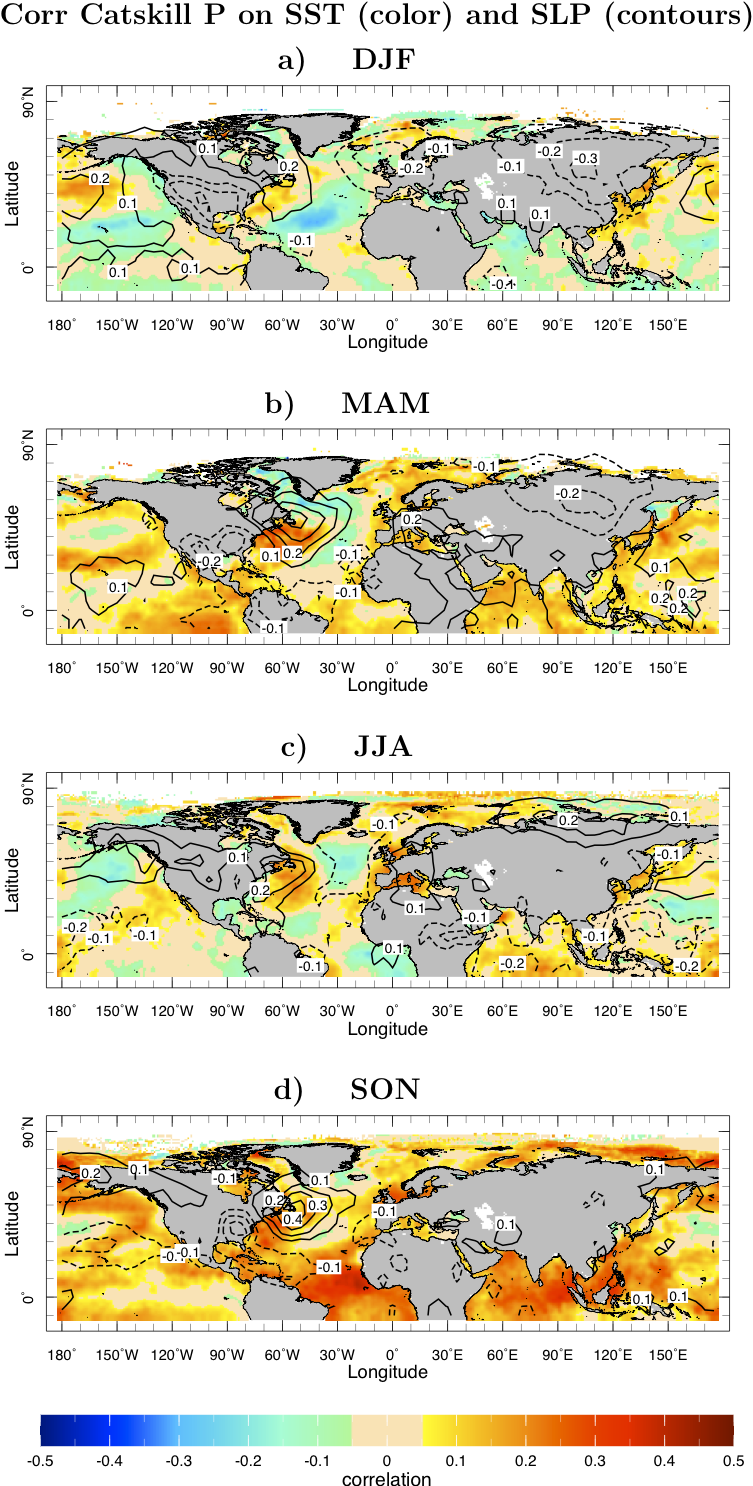
As is standard in this business we used linear correlation and regression analysis to relate the history of greater Catskills precipitation to atmospheric circulation and SSTs and did this for the four seasons. The 500mb height patterns show that wet conditions in the region are related to southerly flow anomalies contained within wave trains that are confined to the mid-latitudes (i.e. not forced from the tropics) and look as if they arise from internal mid-latitude atmosphere dynamics. The sea level pressure (SLP) patterns (Figure 6 from paper goes here) show similar features with southeasterly flow into the region when it is wet. Such flow would be expected to be ascending and moisture bearing so these patterns make sense. The SST anomalies are consistent with being forced by the atmosphere flow anomalies via surface heat fluxes and oceanic gyre adjustment. Again this is all suggestive of dry and wet years in the greater Catskills region arising from internal atmosphere dynamics rather than possibly being forced from the tropical oceans (as is the case for the southwest and southern Plains).
|
| Fig. 3. The correlation between precipitation averaged over the greater Catskills region and SST and SLP for the DJF (top), MAM (upper middle), JJA (lower middle) and SON (bottom) seasons. SLP data are from the 20th Century Reanalysis and correlations are over the 1901 to 2007 period. |
|
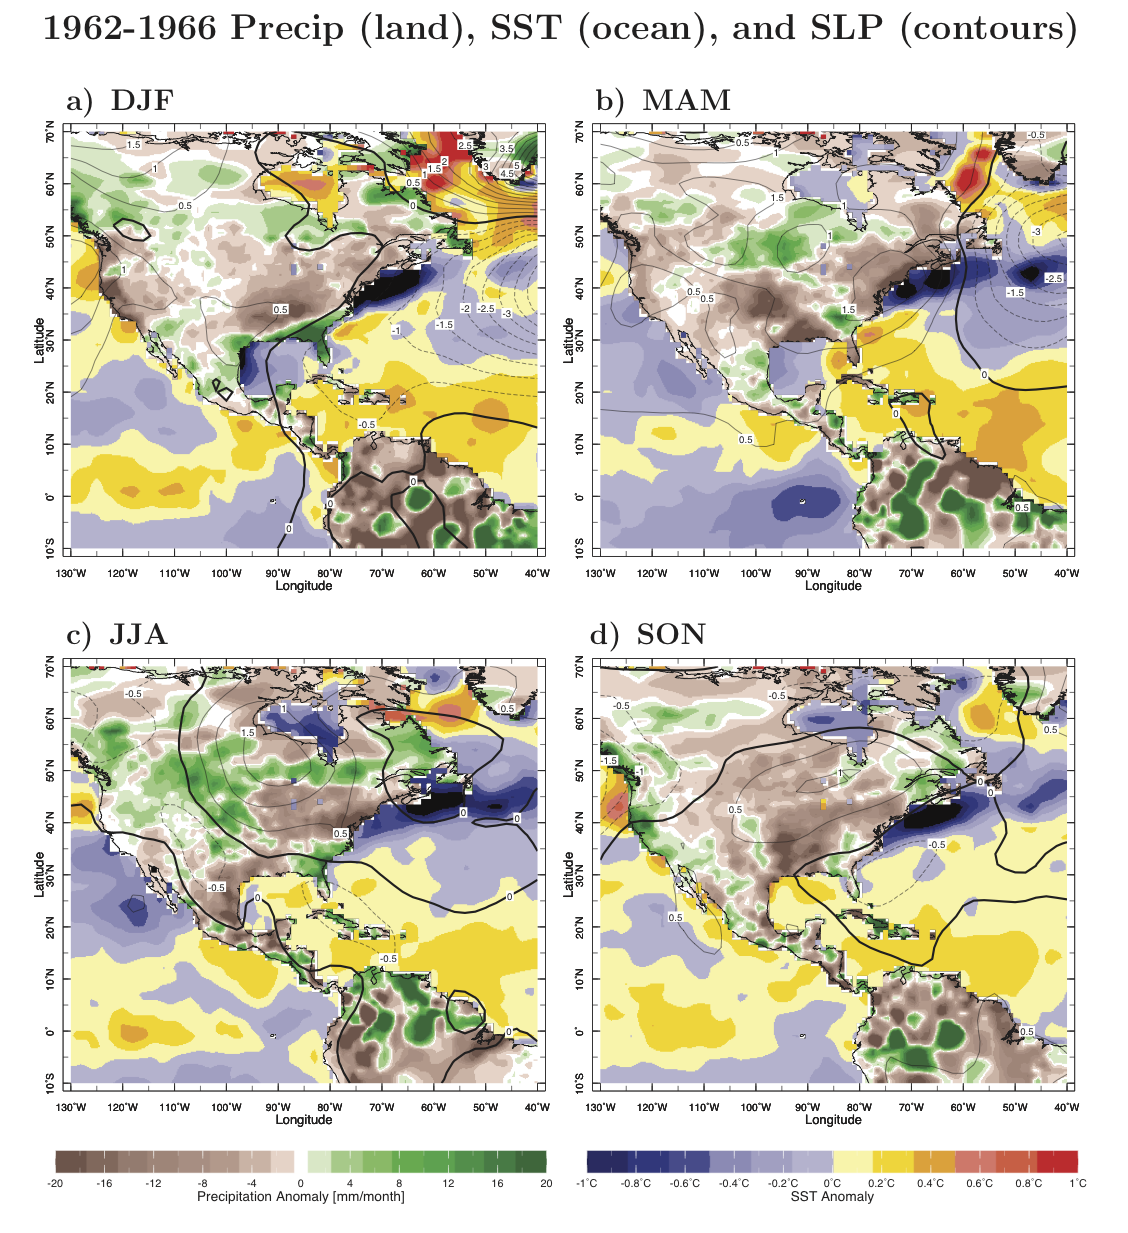
| Fig. 4. Anomalies from the 20CR of the sea level pressure (contours, units of mb), SST (col- ors over ocean, units of ◦C) and GPCC precipitation (colors over land, units of mm/month) for the winter (DJF, top left), spring (MAM, top right), summer (JJA, lower left) and fall (SON, lower right) seasons of the 1962 to 1966 drought. |
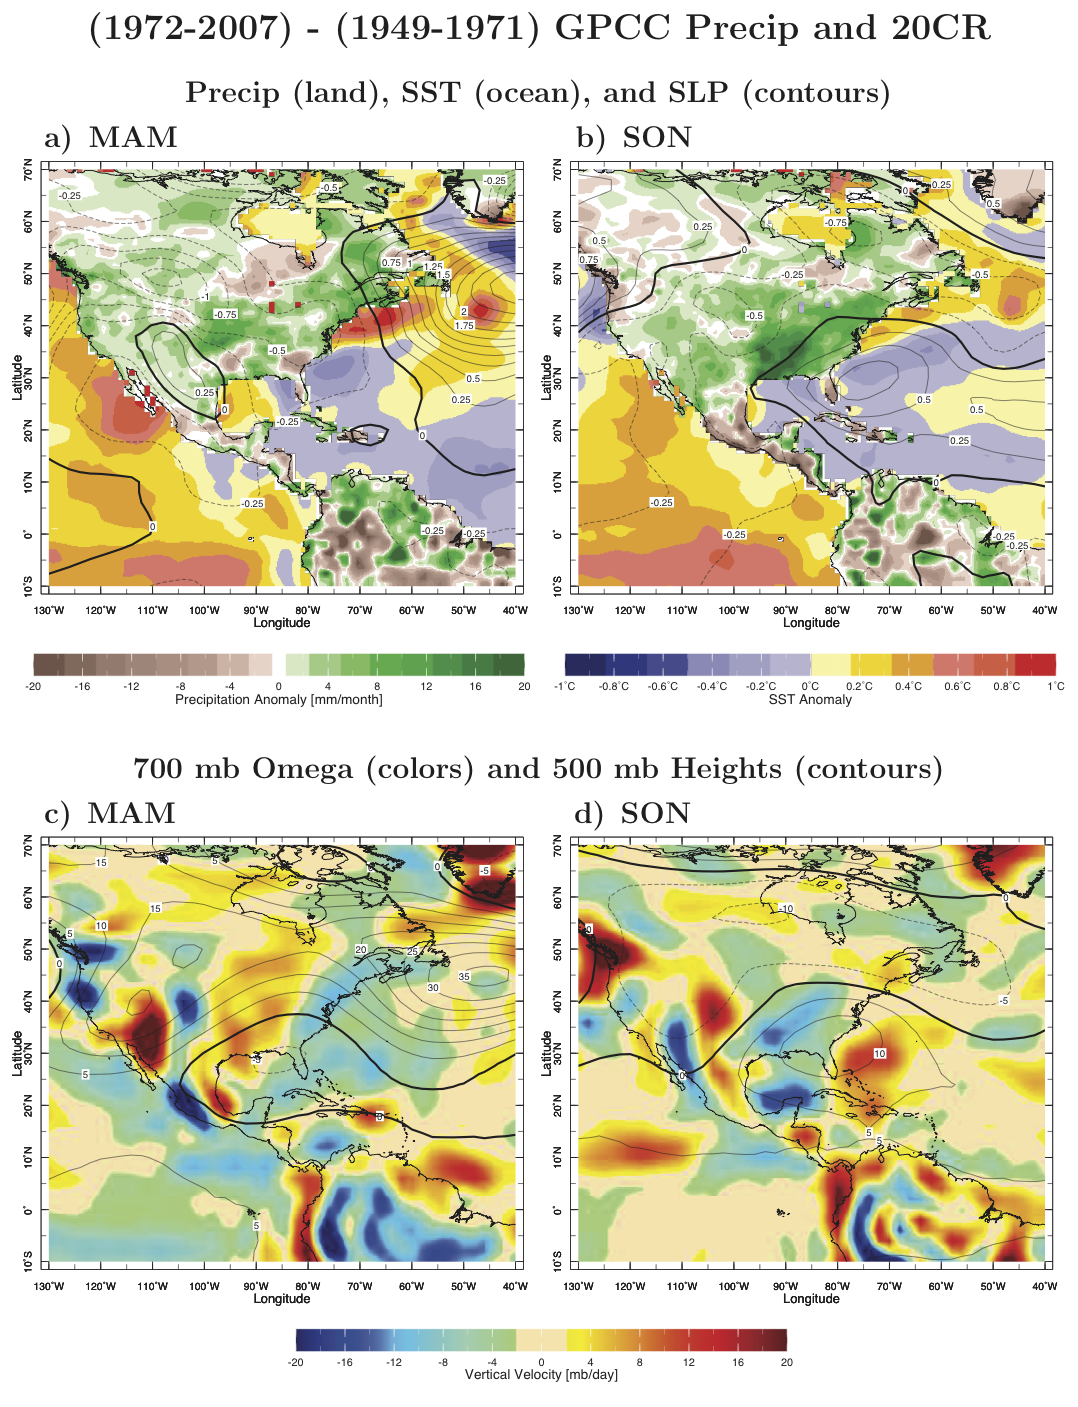
The pluvial that followed the drought was not simply the opposite of the drought. As shown (Figure 9 from paper goes here) during spring there was a huge high pressure anomaly over the Atlantic northeast of the region and during fall there was a high anomaly offshore from the southeast U.S. Both placed flow with a southerly aspect and rising motion over the eastern U.S. which would be expected to favor increased precipitation. Above normal precipitation since the early 1970s was very widespread across eastern North America. Again there is little evidence that the circulation anomalies associated with the pluvial were linked to the tropics and again appear rooted in mid-latitude atmospheric dynamics.
|
| Fig. 5. The difference between the period after 1972 and 1949-1971 for (top row) GPCC precipitation (colors over land, mm/month), SST (colors over ocean, K) and SLP from the 20th Century Reanalysis (contours, mb) and (bottom row) 500mb heights (contours) and 700mb vertical velocity (colors) from the 20C3R5 for the spring (left) and fall (right) seasons. Units are mm/day for precipitation, mb for SLP, ◦C for SST, meters for height and mb/day for vertical pressure velocity. |
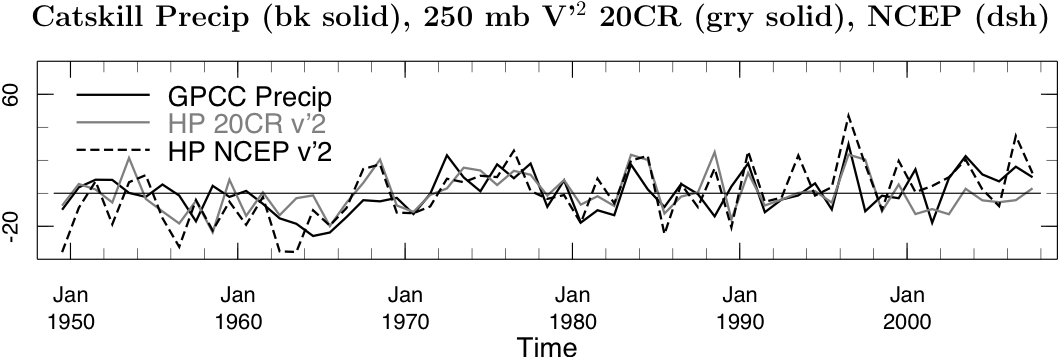
A curious feature of the post 1960s transition to a wetter climate in the greater Catskills region is that it lines up in time nicely with a strengthening of the northern hemisphere storm track over the eastern Pacific, North America and western Atlantic. This strengthening appears in the NCEP Reanalysis data but also in radiosonde data (Harnik and Chang 2003). We show that it also appears in the 20th Century Reanalysis which only assimilates SLP data and is therefore another piece of evidence for the realism of this strengthening. This figure (Figure 11 from the paper goes here) shows the time series of annual mean greater Catskills precipitation and the strength of the storm track (as recorded by high pass filtered upper tropospheric meridional velocity variance) in the NCEP and 20th Century Reanalyses. The shift up in the early 1970s and the year to year variability of the precipitation and the storm track strength match each other quite well. The cause of the storm track strengthening is however unknown. We suspect that it is not simply related to the upward trend of the North Atlantic Oscillation. It needs more analysis!
|
| Fig. 6. Time series of annual mean precipitation (black) and 250mb high pass filtered eddy meridional velocity variance from the NCEP (dashed) and 20CR (gray) Reanalyses all for the greater Catskills region. Units are mm/day and m2s−2. |
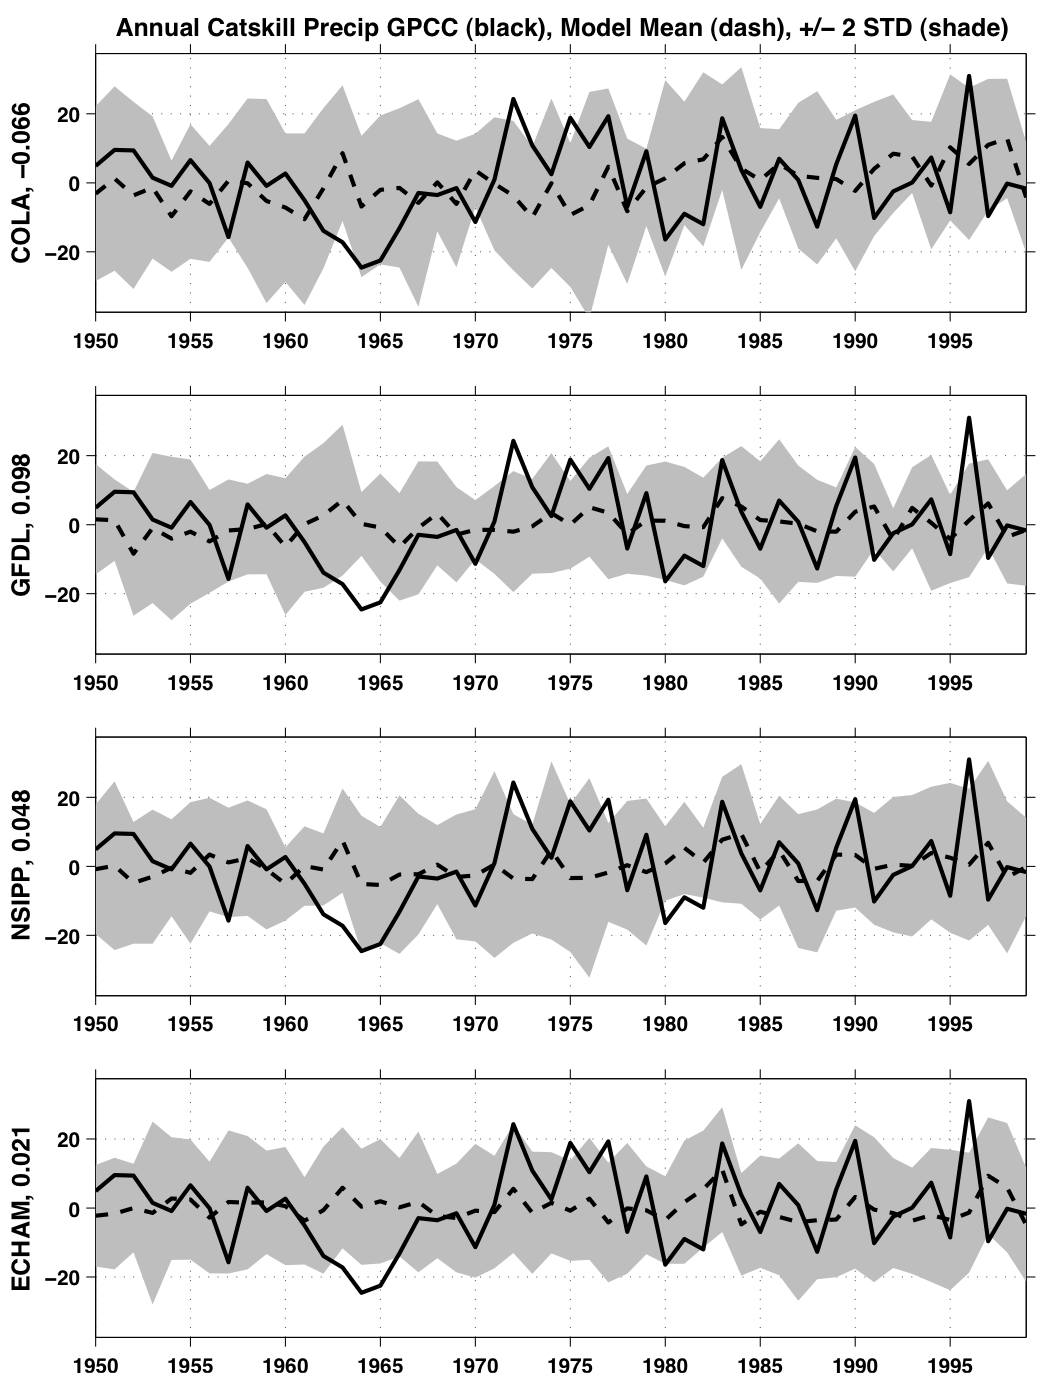
We next analyzed ensemble simulations with atmosphere models forced by historical observed SSTs. The extent to which the ensemble mean, which averages over the uncorrelated weather variability in the ensemble members, tracks the observed record is a measure of the extent to which the latter was forced by the SST variations. We examined 3 sets of simulations we did with NCAR models at Lamont and also 4 other shorter simulations with other models. In none of these can greater Catskills precipitation - neither the year to year variability nor the drought and pluvial - be reproduced as an atmospheric response to observed SST variations. Here we just show the century long examples from the 3 NCAR models (Figure 13 from paper goes here). (Note that we have used NCAR CCM3 very successfully in simulations of ocean-forced droughts in the southwest and Plains.)
|
| Fig. 7. Same as Figure 9 but for four ensembles of atmosphere GCMs and the 1950 to 2000 period only for the COLA (top), GFDL AM2.1 (upper middle), NSIPP (lower middle) and ECHAM 4.5 (bottom) models. Units are mm/month. |
We also examined the 24 models used by IPCC AR4 (published in 2007) for any evidence of a wetting trend in the region induced by rising greenhouse gases and other changes in radiative forcing. These simulations show no evidence of wetting trends in the greater Catskills region and, in fact, no trends at all. This is because this region falls between a region of drying in the southwest and moistening further north. So there is no evidence that the pluvial was forced by either SSTs or anthropogenic climate change, further implicating internal atmospheric variability with very long timescales!
It would have been good to use atmospheric Reanalyses to delve into the moisture budget and determine the causes of precipitation anomalies for the drought and pluvial (i.e. the moisture transport, convergence and divergence anomalies that link circulation to precipitation). However we tried this and, as for multiyear droughts in the West, the NCEP and 20CR Reanalysis budgets fail to consistently capture these events due, presumably, to inadequacy of the observing systems in use (then and, we think, now). This is a cautionary tale in that it means we are unable to fully explain the causes and character of such socially important climate events - even in the well observed U.S.!
To conclude, the 1960s drought and the subsequent pluvial appear to have been caused by mean and transient atmospheric circulation anomalies that were unrelated to ocean conditions. Consequently they are unpredictable on timescales longer than that of extended weather forecasting. The pluvial, and the long term trend to wetter conditions that it represents, is also not a consequence of radiatively-driven climate change. Hence a drought like that of the 1960s could easily return to the greater Catskills region without warming and without the ability to predict how long it will continue. Similarly it cannot be assumed the wetter conditions in the NYC watershed since the early 1970s will persist. A return to a drier climate, or the occurrence of another multiyear drought, would place considerable stress on the City's water supply. The possibility that this might happen needs to be factored into decision making on management of the City's water resources.
REFERENCES
- Seager, R., N. Pederson, Y. Kushnir, J. Nakamura and S. Jurburg, 2012: The 1960s drought and the subsequent shift to a wetter climate in the Catskill Mountains region of the New York City watershed. J. Climate, 25, 6721-6742, DOI: 10.1175/JCLI-D-11-00518.1. PDF