
|
| Fig. 1 Summer season (June-July-August, JJA) PDSI anomalies from the NADA, averaged across all pluvial years (1905-1917). |
The 'Early 20th Century North American Pluvial' refers to a period of enhanced moisture availability across Western North America that occurred in the first two decades of the century and often delimited by 1905 to 1917. It has a peculiar and interesting history as it directly preceded the 1922 Colorado River Compact that began the legal division of Colorado River flow between states. The division was based on several years of measured flow that, because they occurred during the Pluvial, were much higher than anything that has occurred since. This fact has created political and legal problems in regard to apportionment of the River to date!
|
|
| Fig. 1 Summer season (June-July-August, JJA) PDSI anomalies from the NADA, averaged across all pluvial years (1905-1917). |
But what caused the Pluvial? It has taken us a long time to write anything about it because it just did not seem to fit the overarching story of the West's hydroclimate history. Since the long droughts are caused by persistent La Niña-like conditions in the tropical Pacific Ocean, with warm subtropical North Atlantic sea surface temperature (SST) anomalies sometimes playing a role too, it would be reasonable to think that the Pluvial was caused by either a warm tropical Pacific, a cold subtropical Atlantic, or some mix of both. After all, another time of wet conditions from the late 1970s to the late 1990s has been explained in terms of more El Niño-like conditions during those decades following the famed 1976/77 Pacific climate shift. However 1905-17 did not fit this agenda: Atlantic SST anomalies were anemic and the tropical Pacific did have a couple of decent sized El Niños but also a La Niña right in the middle of the Pluvial.
So, liking a challenge and led by Ben Cook (of NASA GISS), we finally did a detailed study of the Pluvial and have submitted a paper on this Cook et al., 2011. Here is a summary of the results:
1. The Pluvial was extraordinarily widespread. Figure 1 show the Palmer Drought Severity Index (PDSI) averaged over 1905-17 from the tree-ring-based North American Drought Atlas (NADA) data and shows wet conditions from Mexico into Canada and from the Pacific across the Great Plains, This is a truly remarkable spatial extent. It is far more common to see, for example, opposite sign hydroclimate anomalies in the southwest and northwest of North America. Figure 1 shows three boxes for areas we analyzed further (the Southwest, the Northwest and the Central Plains).

|
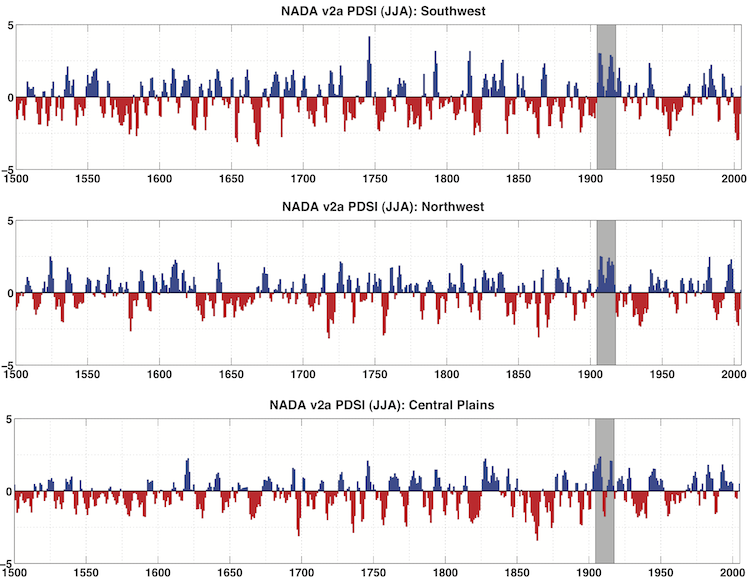
| Fig. 2 Area averaged summer season (June-July-August, JJA) PDSI from the NADA v2a for 1500-2005. All time series are smoothed with a five year lowess filter. Time series correspond to the outlined boxes in Figure 1: the southwest (SW; 125°W-103°W, 25°N-42°N), the northwest (NW; 125°W-103W, 42°N-50°N), and the central plains (CP; 103°W-90°W, 35°N-50°N). ) |
3. The Pluvial was the result of a regionally varying mix of temperature and precipitation anomalies (from CRU data) as shown in Figure 3 and 4. The Pluvial had cold anomalies across the West and Central Plains that would have reduced evapotranspiration and increase soil moisture and streamflow. These cold temperatures were not the result of simply being the beginning of the warming trend due to rising greenhouse gases as the 19th Century had warmer conditions. Instead the cold presumably arose from some as yet unexplained climate variability. Cold was quite widespread in the northern hemisphere during the Pluvial decades. During the winters of the Pluvial there was a strong positive precipitation anomaly in the Southwest and Central Plains that contributed strongly to the wet conditions. However in the Northwest the Pluvial must have arose from cold temperatures as the precipitation anomalies here were weaker, variable by season, and actually negative during the winter, moisture supply, part of the year.
| Fig. 3 Seasonal temperature anomalies during 1905-1917 from the CRU 2.1 climate grids, relative to the 1961-1990 mean (K). | 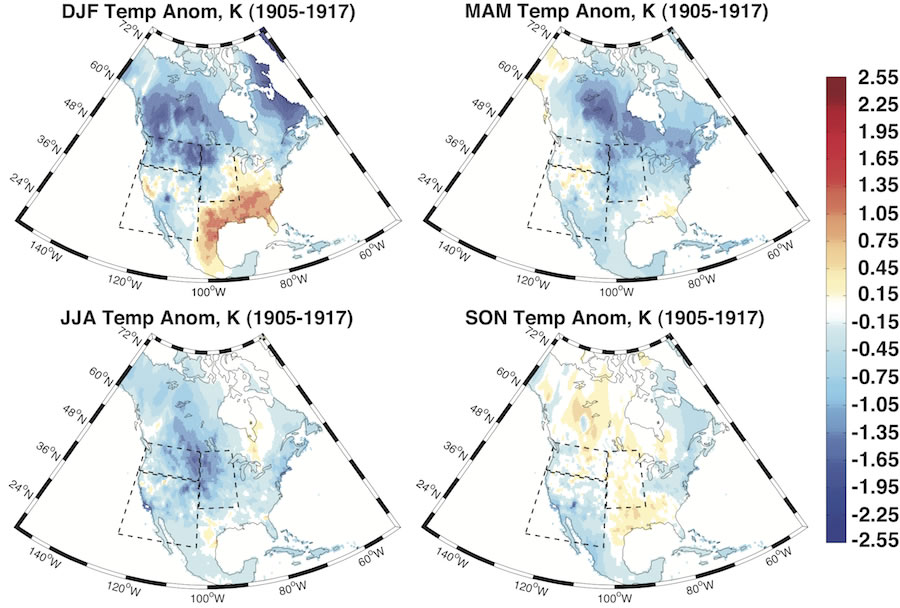 |
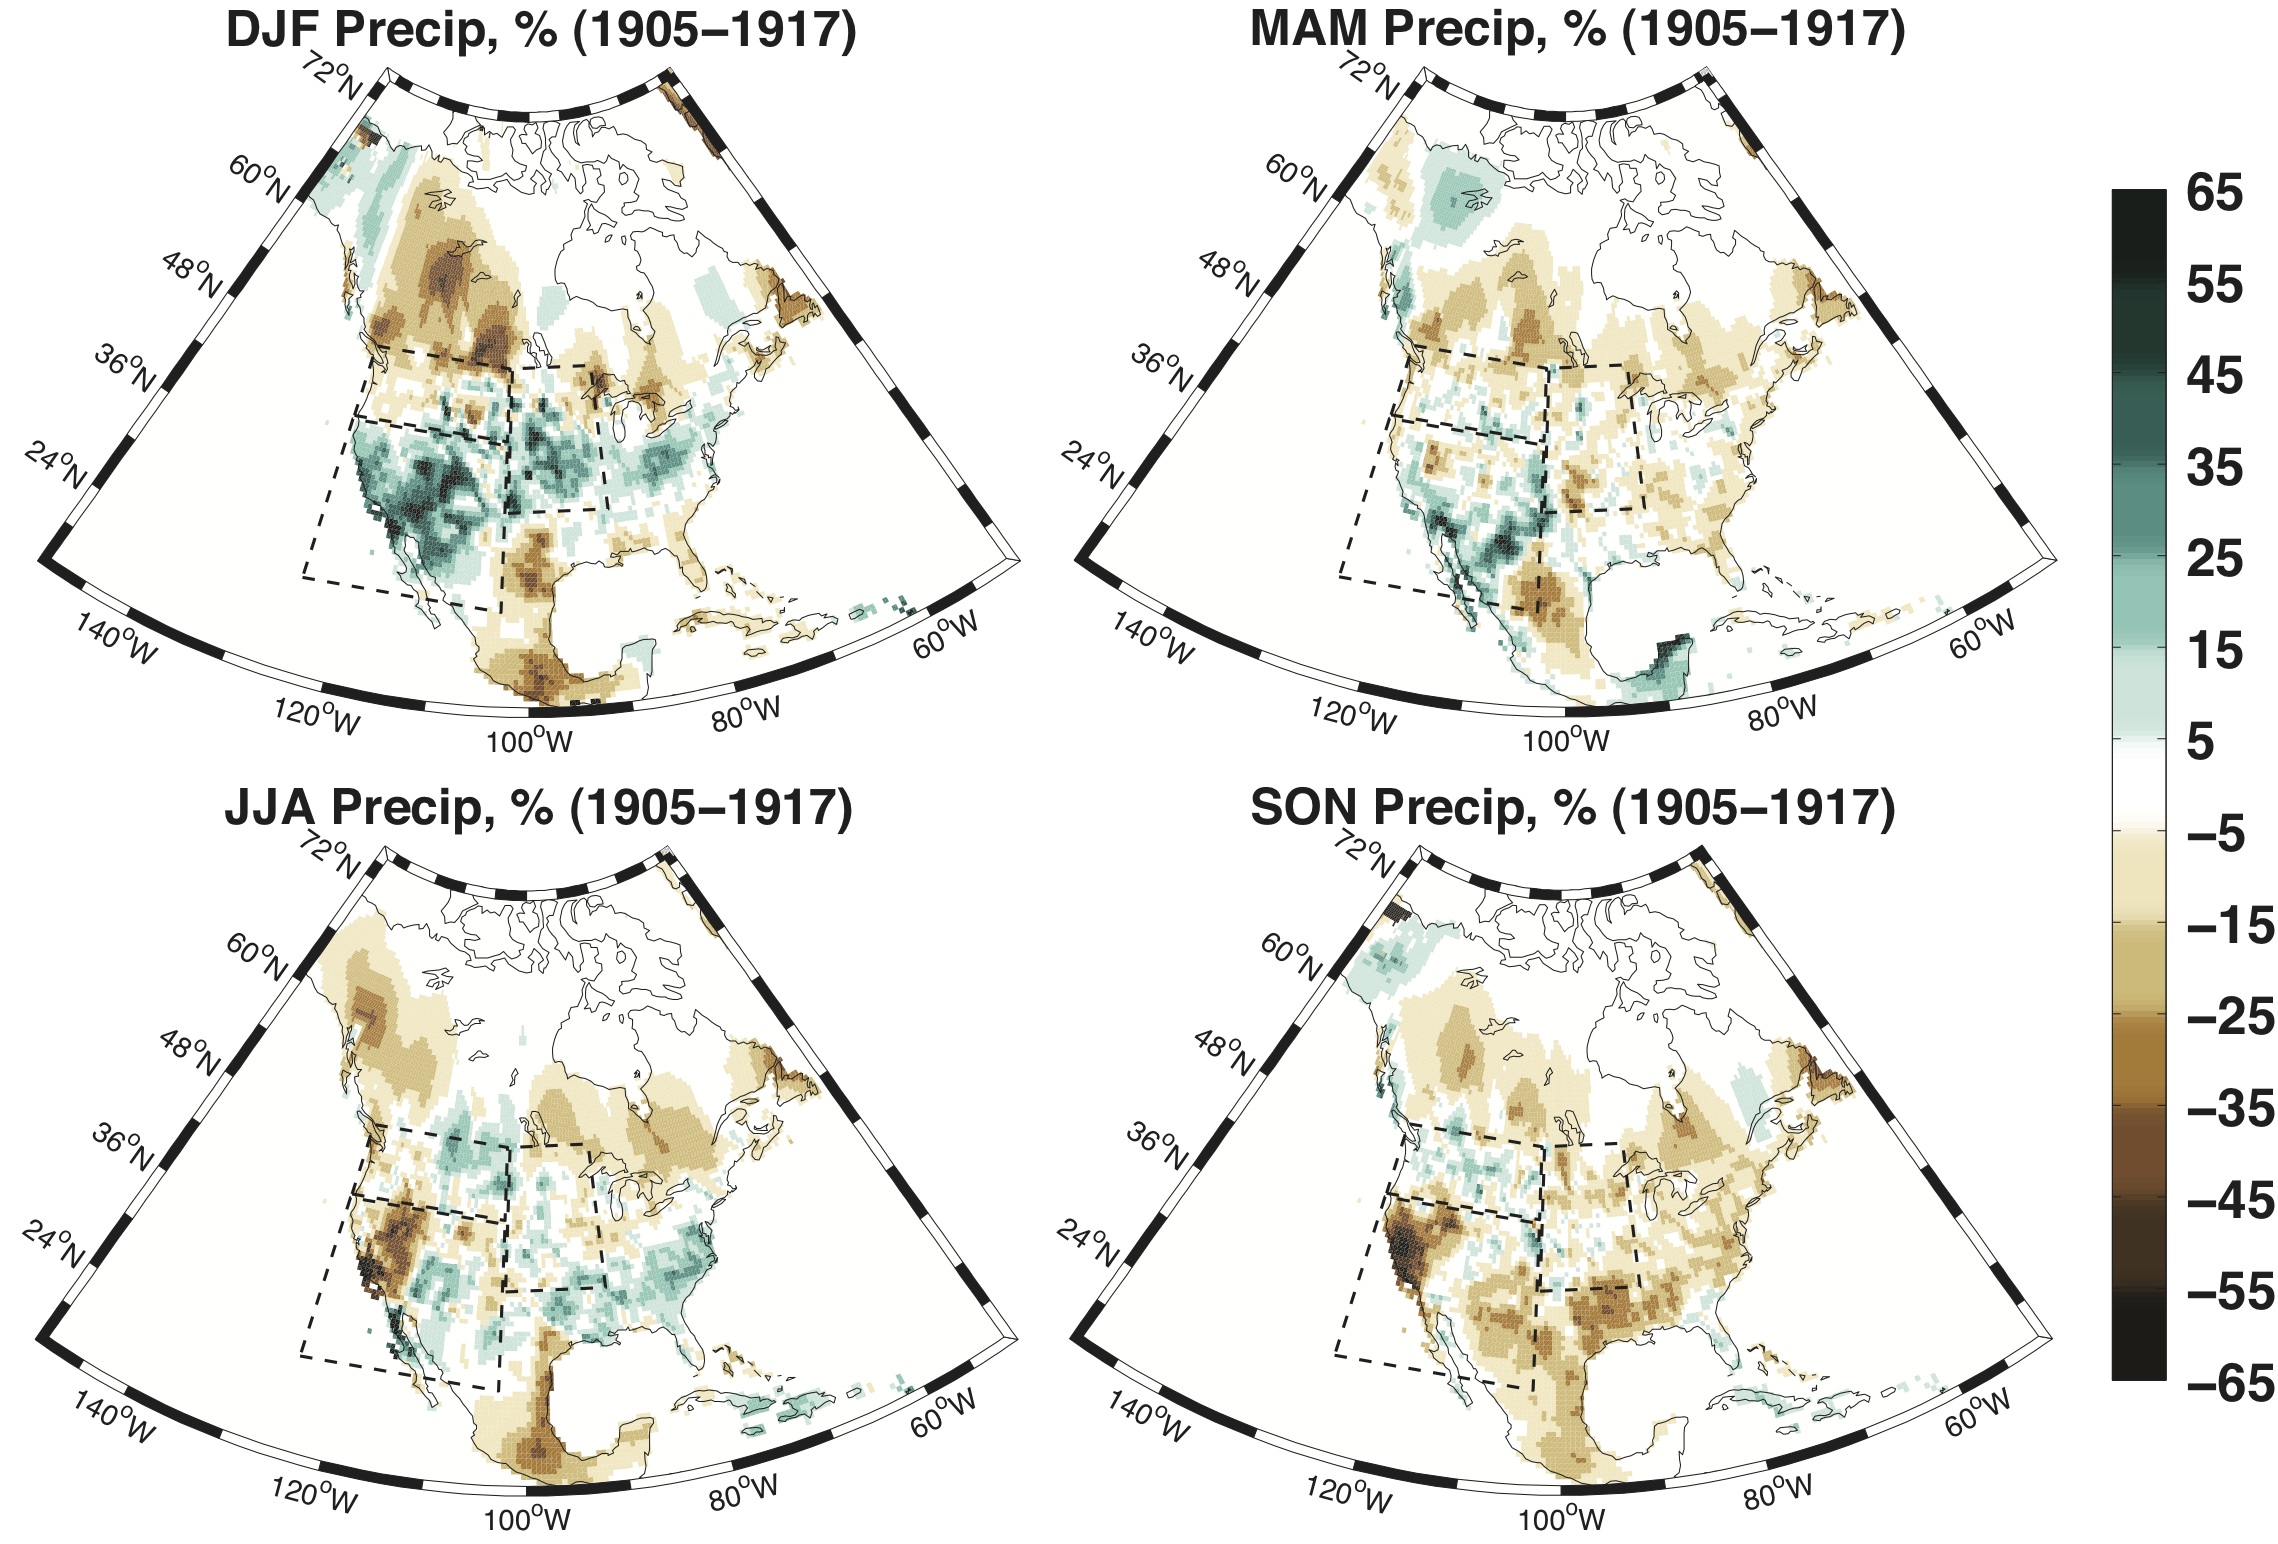 |
Fig. 4 Precipitation anomalies during 1905-1917 from the CRU 2.1 climate grids, expressed as percent difference relative to the 1961-1990 mean. | |||
| Fig. 6 (from paper) Summer season (JJA) PDSI calculated from the CRU 2.1 precipitation and temperature climate grids averaged over the southwest (SW, left column), northwest (NW, center column), and central plains (CP, right column). For the pluvial period (1905-1917), PDSI is alternately calculated with observed temperature and observed precipitation (top row), climatological tempera- ture and observed precipitation (center row), and observed temperature and climatological precipitation (bottom row). | 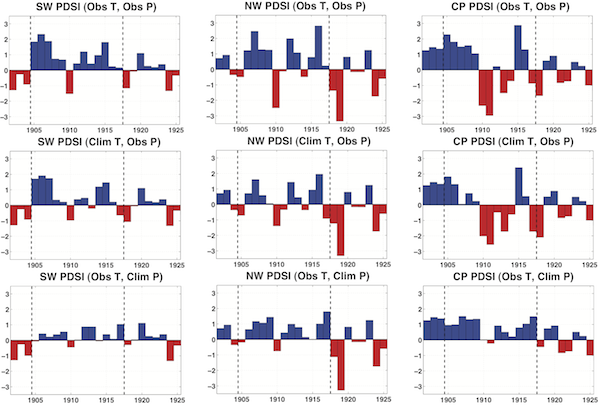
|
||
| Fig. 11 (from paper) Composite 500 hPa geopotential heights anomalies (meters), averaged over the pluvial (1905-1917) for each season. | 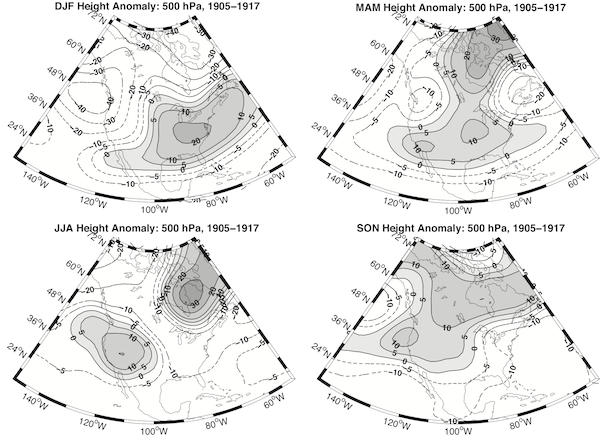
|
||
To conclude, the early 20th Century pluvial was a unique event in the last 500 years of North America hydroclimate history and it is a great irony that it just so happened to precede the 1922 Colorado River Compact. Unlike the great North America droughts, which can almost entirely be understood in terms of reductions of precipitation, the Pluvial arose from a combination of wet conditions in the Southwest and cool temperatures across the continent. Also unlike the droughts it is not well simulated by a model forced by historical SSTs indicating less oceanic control over it than is typical for droughts. An important topic of research needs to be to explain the cold temperatures during 1905-17. Nonetheless western North America has steadily warmed since the Pluvial which, together with the fact that models predict much of the Southwest and Plains to dry as a consequence of how rising greenhouse gases impact the hydrological cycle, makes it exceedingly unlikely that similar moist conditions will ever return.