12. Projected changes in U.S. rainfall erosivity - PDF In a new paper Biasutti and Seager examined what can be said about changes in rainfall erosivity over the U.S. as a result of climate change. It is commonly expected that climate change will lead to more soil and land erosion as a result of increasing intensity of precipitation. i.e. more of the total precipitation falling in intense storms. It is even thought this might apply in regions where the mean precipitation decreases. Actual erosion depends on more than the rainfall erosivity: soils, topography, vegetation cover, land management etc. Nevertheless rainfall erosivity is rather straightforwardly expected to change as climate changes and, in the absence of change in the other factors, would translate into changes in soil erosion. The erosivity factor, R, is defined as the annual sum of erosivity from individual storms. Storm erosivity is determined as the sum of rainstorm energy (an empirical function of intensity and depth of rainfall) and the maximum 30 minute rainfall intensity in the storm. This evaluation requires gauge data at least 30 minute resolution and makes evaluation of R exceedingly difficult with current data. This has invited a lot of approximations that use coarser temporal resolution data, including the modified Fournier Index which uses monthly data.
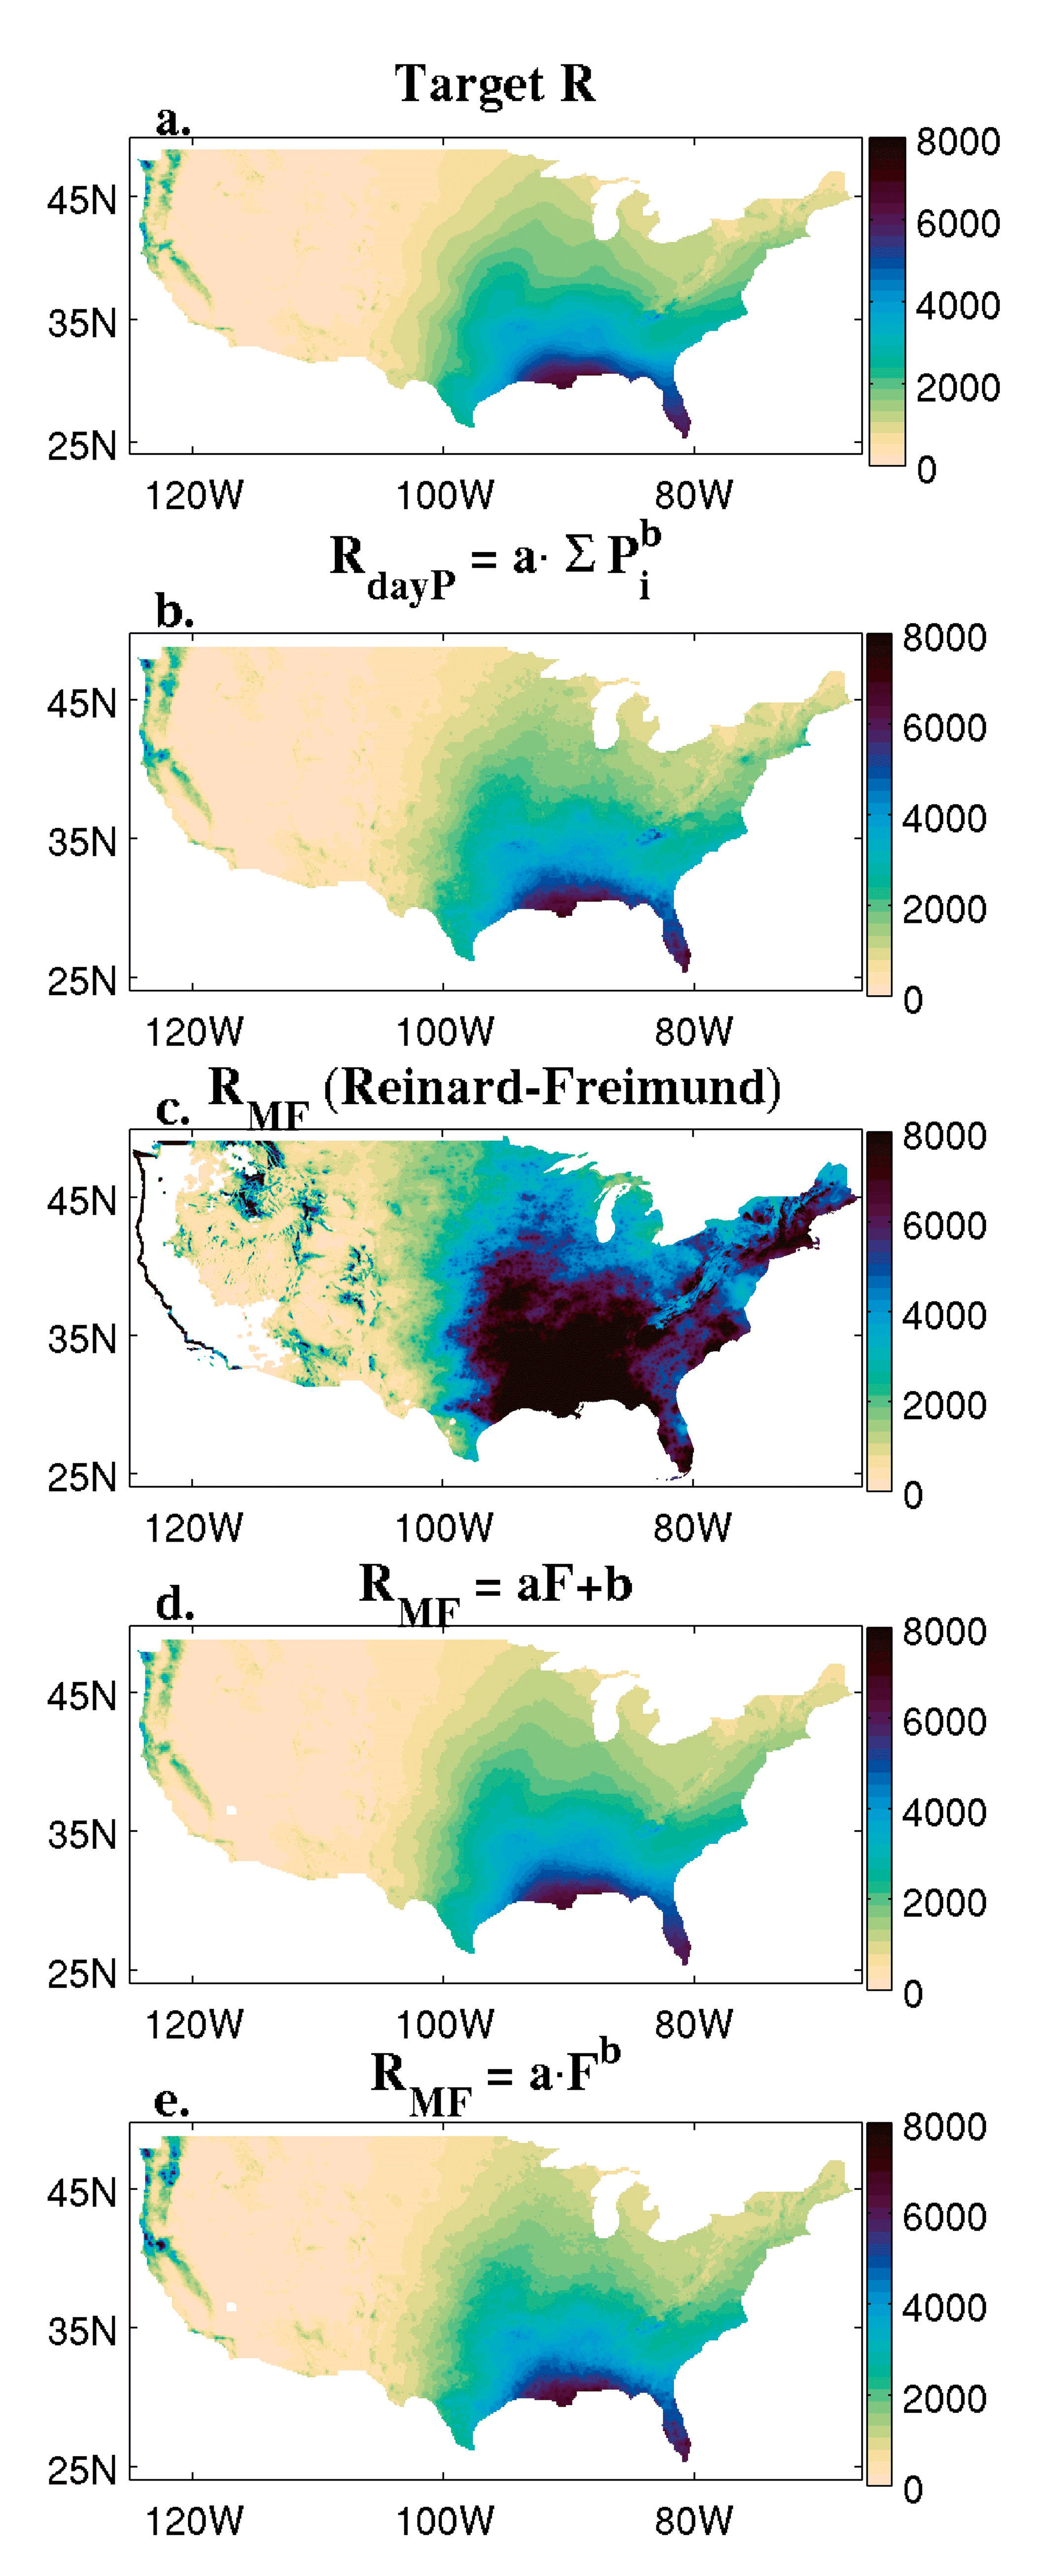
For the U.S. there is a erosivity map in use by the EPA that was constructed beginning with 1505 stations with 15 minute data. From these an approximation using more widely spread daily data was developed. The complete map used the PRISM spatial interpolation techniques to develop a 4km resolution all U.S. map of R for the 1971-2000 period. In this study this was our "target" R. In this study we then make our best effort to develop as estimate of R from daily data from downscaled CMIP5 simulations of the historical period and then do the same for the future and evaluate changes in rainfall erosivity as the difference. We also use monthly data to 1) calculate changes in R that are based on changes in the modified Fournier Index and 2) calculate changes in the so-called "Burst Factor" which uses maximum daily rainfall within a month. The calculation is fraught with uncertainties. First of all model rainfall intensities are biased too weak. Second the method needs downscaled models but changes in those models might not be representative of changes in larger global model ensembles. This the relationship between daily precipitation and the erosivity index is quite uncertain.
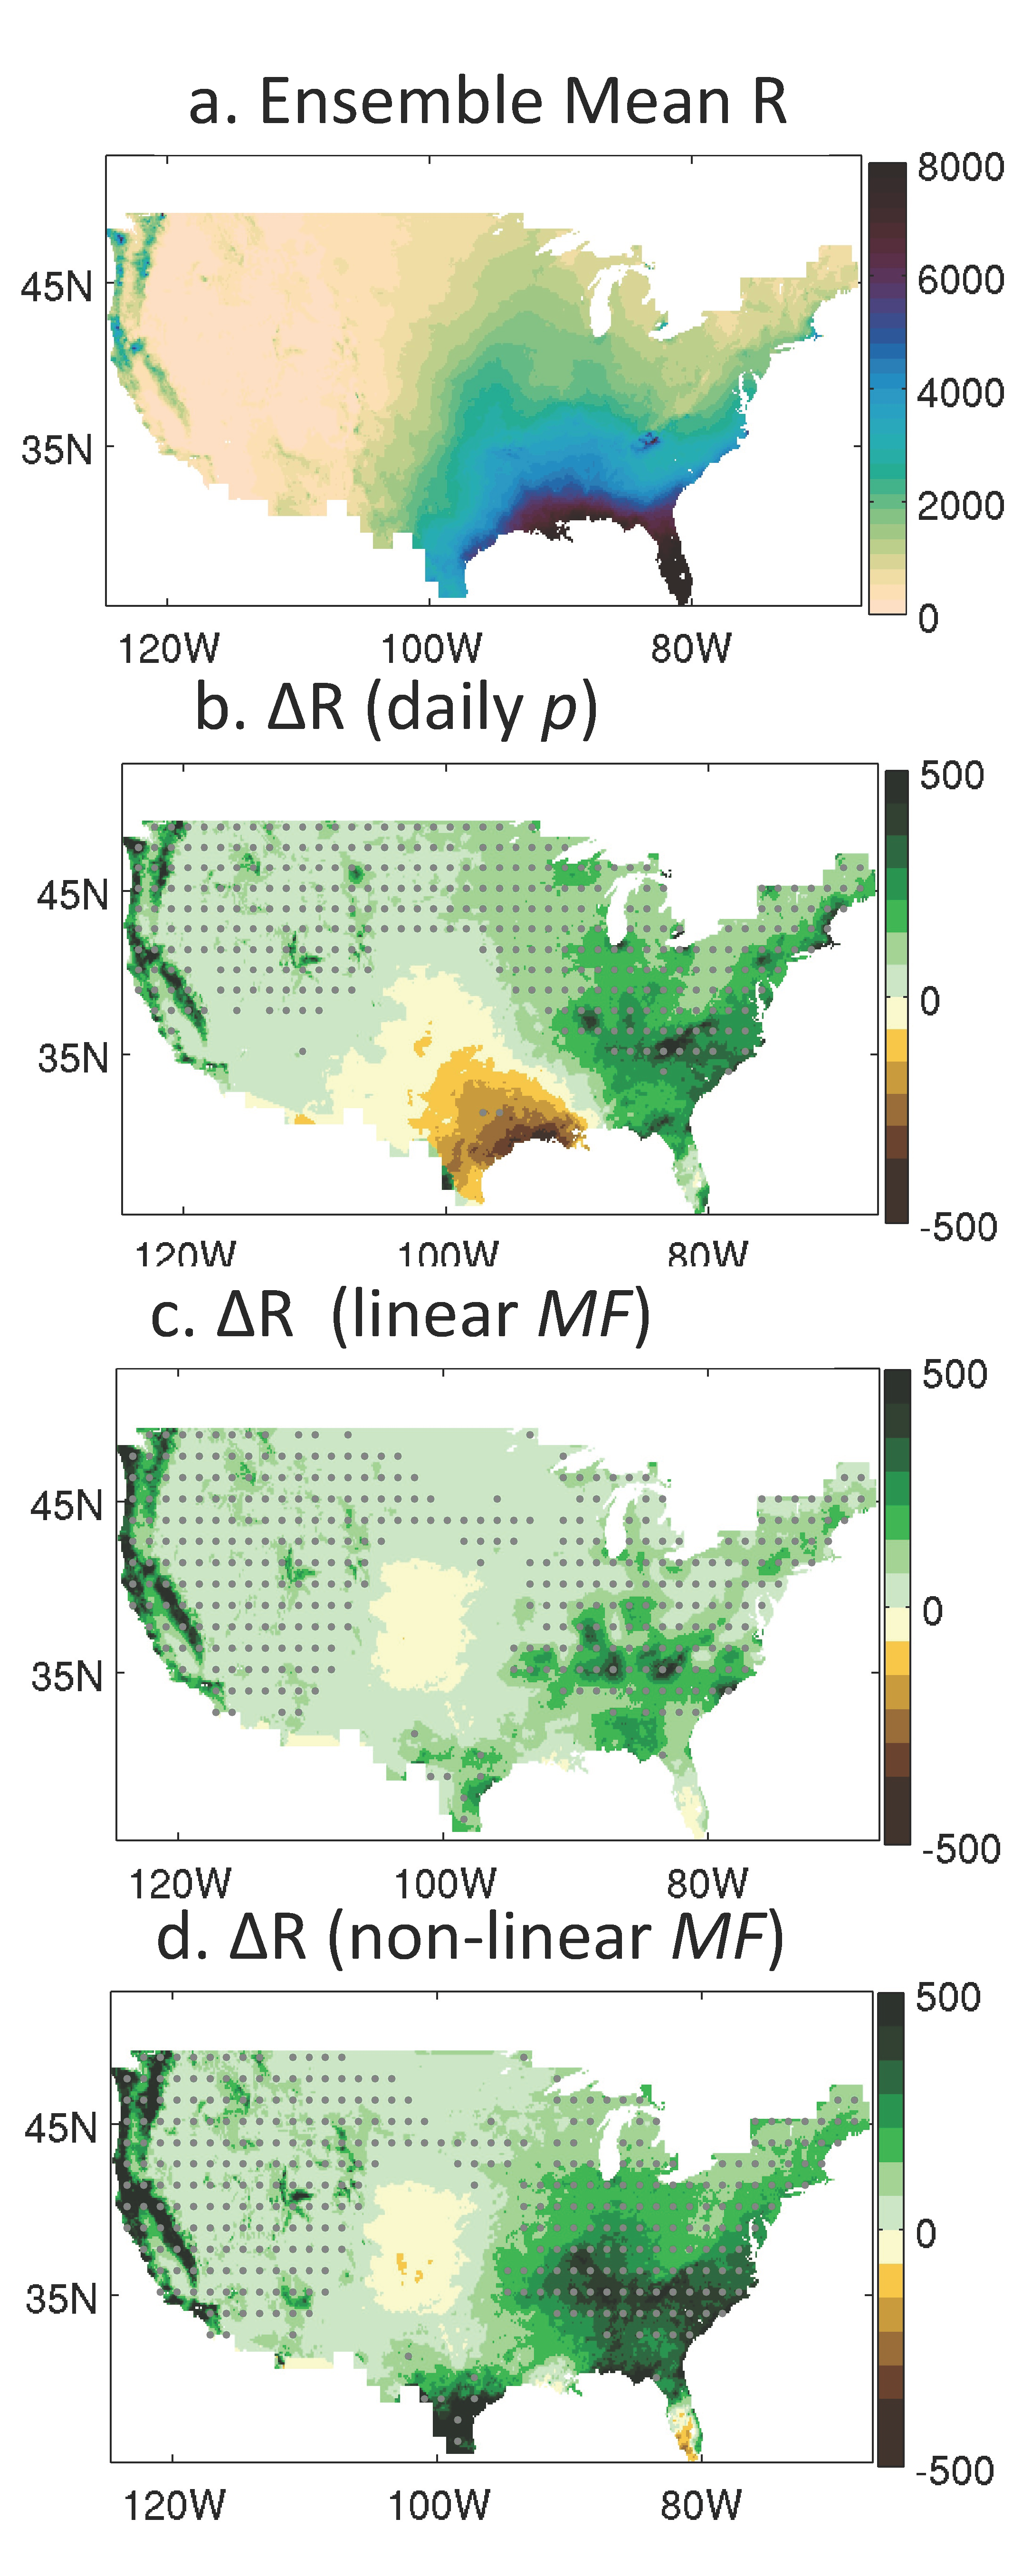
Nonetheless the general expectation of increased erosivity under climate change is confirmed. The increase quite closely matches the change in the mean rainfall. Since rainfall is projected to increase across most of the US under climate change the erosivity does too and decreases are limited to the southwest U.S. However using the monthly data some regions of Texas and the southern Plains see an increase in erosivity even as the total mean precipitation declines, which must be because the seasonal precipitation cycle becomes wetter in the wettest months. The work provides some guidance for how rainfall erosivity will change but even more guidance for how to improve such estimates in the future. Until then it is hard to be too precise or quantitative about future changes in erosivity other than in most parts of the U.S. it will increase. REFERENCES
|
 EASM2: LINKING NEAR-TERM FUTURE CHANGES IN WEATHER AND HYDROCLIMATE IN WESTERN NORTH AMERICA TO ADAPTATION FOR ECOSYSTEM AND WATER MANAGEMENT EASM2: LINKING NEAR-TERM FUTURE CHANGES IN WEATHER AND HYDROCLIMATE IN WESTERN NORTH AMERICA TO ADAPTATION FOR ECOSYSTEM AND WATER MANAGEMENT | |
| Lamont-Doherty Earth Observatory of Columbia University 61 Route 9W Palisades, NY 10964
| |
|
| |