4. Causes of modern era western droughts from the Dust-Bowl to the current California drought Causes and predictability of the California drought of 2011 to 2014 - PDF The causes and predictability of the California drought during the November to April winters of 2011/12 to 2013/14 are analyzed using observations and ensemble simulations with seven atmosphere models forced by observed sea surface temperatures (SSTs). Historically, dry California winters have most commonly been associated with a ridge off the west coast but no obvious SST forcing. Wet winters have most commonly been associated with a trough off the west coast and an El Niño event. These attributes of dry and wet winters are captured by many of the seven models. According to the models, SST forcing can explain up to a third of California winter precipitation variance. SST-forcing was key to sustaining a high pressure ridge over the west coast and suppressing precipitation during the three year drought. In 2011/12 the forced component was a response to a La Niña event whereas in 2012/13 and 2013/14 it was related to a warm tropical west Pacific SST anomaly. All models contain a mode of climate variability that links west Pacific SST anomalies to a northeastward propagating wave train with a ridge off the North American west coast. This mode explains less variance than ENSO and Pacific decadal variability and its importance in 2012/13 and 2013/14 was unusual. The CMIP5 models project that rising greenhouse gases should increase California winter precipitation but that changes to date are small compared to the recent drought anomalies. As such, the recent drought was dominated by natural variability, a conclusion framed by discussion of differences between observed and modeled tropical SST trends over past decades. Causes of Interannual to Decadal Variability of Gila River Streamflow over the Past Century - PDF
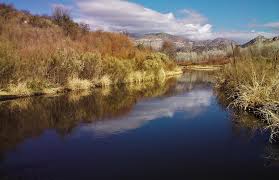
Flow data for the Gila River, New Mexico, show peaks in the winter-spring (December-January-February-March-April-May), and summer (August-September). Winter flow is typically greater than summer flow, although large spikes are found to appear intermittently in summer values. The mechanisms responsible for the variability of the winter-spring and summer streamflow peaks are investigated by correlation of streamflow with precipitation and sea surface temperature for 1928 to 2012. Decadal variability in the flow record is also examined for a longer term perspective on Gila River streamflow. Results indicate a strong coupling between the winter-spring streamflow and winter-spring precipitation and winter-spring streamflow and with Pacific SST with El Niño conditions causing increased precipitation and streamflow. Decadal Pacific variability helps explain the transition from high winter flow in the late 20th century to lower flows in the most recent decade. The summer streamflow has a somewhat weaker correlation with summer precipitation and Pacific SST, and its variability is more likely influenced by local variability within the North American Monsoon. Tree ring-based reconstructions of the Palmer Drought Severity Index and the Standardized Precipitation Index indicate much more severe and extended periods of droughts and pluvials in past centuries as well as periods of concurrent winter and summer drought. The worst North American drought year of the last millennium: 1934 - PDF
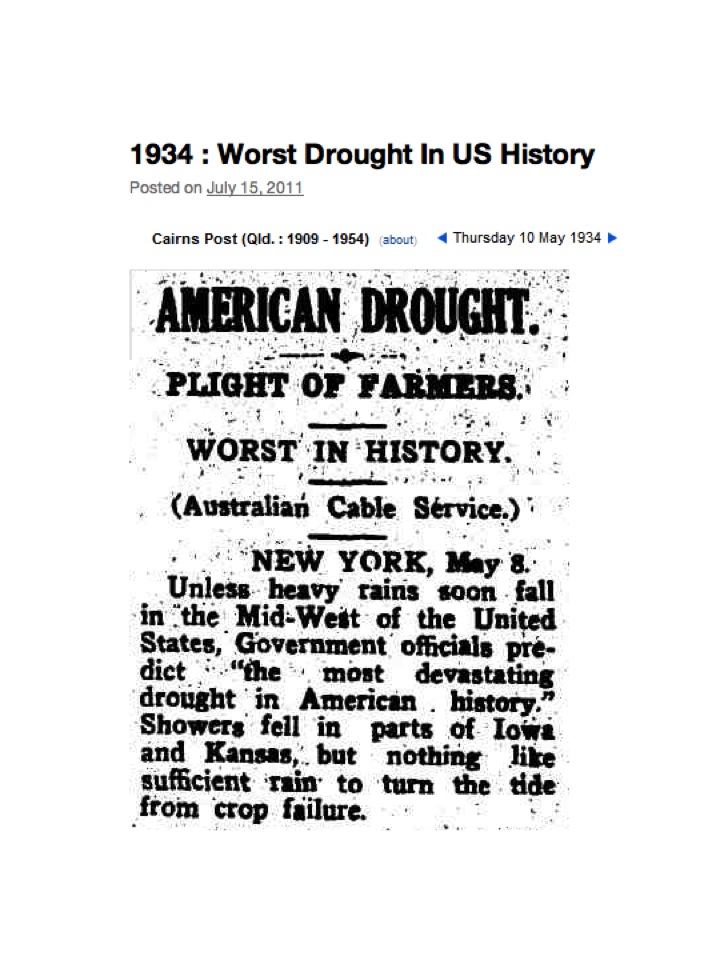
During the summer of 1934, over 70% of western North America experienced extreme drought, placing this summer far outside the normal range of drought variability and making 1934 the single worst drought year of the last millennium. Strong atmospheric ridging along the West Coast suppressed cold season precipitation across the Northwest, Southwest, and California, a circulation pattern similar to the winters of 1976–1977 and 2013–2014. In the spring and summer, the drying spread to the Midwest and Central Plains, driven by severe precipitation deficits downwind from regions of major dust storm activity, consistent with previous work linking drying during the Dust Bowl to anthropogenic dust aerosol forcing. Despite a moderate La Niña, contributions from sea surface temperature forcing were small, suggesting that the anomalous 1934 drought was primarily a consequence of atmospheric variability, possibly amplified by dust forcing that intensified and spread the drought across nearly all of western North America. Atmosphere and Ocean Origins of North American Droughts - PDF
The atmospheric and oceanic causes of North American droughts are examined using observations and ensemble climate simulations. The models indicate that oceanic forcing of annual mean precipitation variability accounts for up to 40% of total variance in northeastern Mexico, the southern Great Plains, and the Gulf Coast states but less than 10% in central and eastern Canada. Observations and models indicate robust tropical Pacific and tropical North Atlantic forcing of annual mean precipitation and soil moisture with the most heavily influenced areas being in southwestern North America and the southern Great Plains. In these regions, individual wet and dry years, droughts, and decadal variations are well reproduced in atmosphere models forced by observed SSTs. Oceanic forcing was important in causing multiyear droughts in the 1950s and at the turn of the twenty-first century, although a similar ocean configuration in the 1970s was not associated with drought owing to an overwhelming influence of internal atmospheric variability. Up to half of the soil moisture deficits during severe droughts in the southeast United States in 2000, Texas in 2011, and the central Great Plains in 2012 were related to SST forcing, although SST forcing was an insignificant factor for northern Great Plains drought in 1988. During the early twenty-first century, natural decadal swings in tropical Pacific and North Atlantic SSTs have contributed to a dry regime for the United States. Long-term changes caused by increasing trace gas concentrations are now contributing to a modest signal of soil moisture depletion, mainly over the U.S. Southwest, thereby prolonging the duration and severity of naturally occurring droughts. Dynamical causes of the 2010/11 Texas-northern Mexico drought - PDF
The causes of the Texas–northern Mexico drought during 2010–11 are shown, using observations, reanalyses, and model simulations, to arise from a combination of ocean forcing and internal atmospheric variability. The drought began in fall 2010 and winter 2010/11 as a La Niña event developed in the tropical Pacific Ocean. Climate models forced by observed sea surface temperatures (SSTs) produced dry conditions in fall 2010 through spring 2011 associated with transient eddy moisture flux divergence related to a northward shift of the Pacific–North American storm track, typical of La Niña events. In contrast the observed drought was not associated with such a clear shift of the transient eddy fields and instead was significantly influenced by internal atmospheric variability including the negative NorthAtlanticOscillation of winter 2010/11, which created mean flow moisture divergence and drying over the southern Plains and southeast United States. The models suggest that drought continuation into summer 2011 was not strongly SST forced. Mean flow circulation and moisture divergence anomalies were responsible for the summer 2011 drought, arising from either internal atmospheric variability or a response to dry summer soils not captured by the models. The summer of 2011 was one of the two driest and hottest summers over recent decades but it does not represent a clear outlier to the strong inverse relation between summer precipitation and temperature in the region. Seasonal forecasts at 3.5 month lead time did predict onset of the drought in fall and winter 2010/11 but not intensification into summer 2011, demonstrating the current, and likely inherent, inability to predict important aspects of North American droughts. REFERENCES
|
 EASM2: LINKING NEAR-TERM FUTURE CHANGES IN WEATHER AND HYDROCLIMATE IN WESTERN NORTH AMERICA TO ADAPTATION FOR ECOSYSTEM AND WATER MANAGEMENT EASM2: LINKING NEAR-TERM FUTURE CHANGES IN WEATHER AND HYDROCLIMATE IN WESTERN NORTH AMERICA TO ADAPTATION FOR ECOSYSTEM AND WATER MANAGEMENT | |
| Lamont-Doherty Earth Observatory of Columbia University 61 Route 9W Palisades, NY 10964
| |
|
| |