 |
|
LAMONT-DOHERTY EARTH OBSERVATORY THE EARTH INSTITUTE AT COLUMBIA UNIVERSITY |
|
| Drought Research | |

Was the Dust Bowl predictable?
Richard Seager
Lamont-Doherty Earth Observatory of Columbia University
Recent modeling work (Schubert et al. 2004a,b, Seager et al. 2005) has claimed that the Dust Bowl drought of the 1930s was forced by small changes in tropical SSTs, essentially several persistent years of La Niña-like conditions in the Pacific and a warm subtropical North Atlantic Ocean, both of which are assumed to have had natural origins. If this is so then it means that, had the SSTs been known in advance, it would have been possible to predict that the drought was to occur and, perhaps, the environmental and social catastrophe of the Dust Bowl could have been ameliorated.
Fundamentally that would have depended on being able to predict the SSTs and we currently do not know if tropical SSTs are predictable to any useful degree beyond the interannual timescale with only a few studies having looked into this (Karspeck et al. 2004, Seager et al. 2004). Here we take a different tack and place ourselves in 1929 and ask the more limited question: If the SSTs in the 1930s were foreknown could the drought have been predicted? The paper (Seager et al. 2007) appeared in the Journal of Climate.
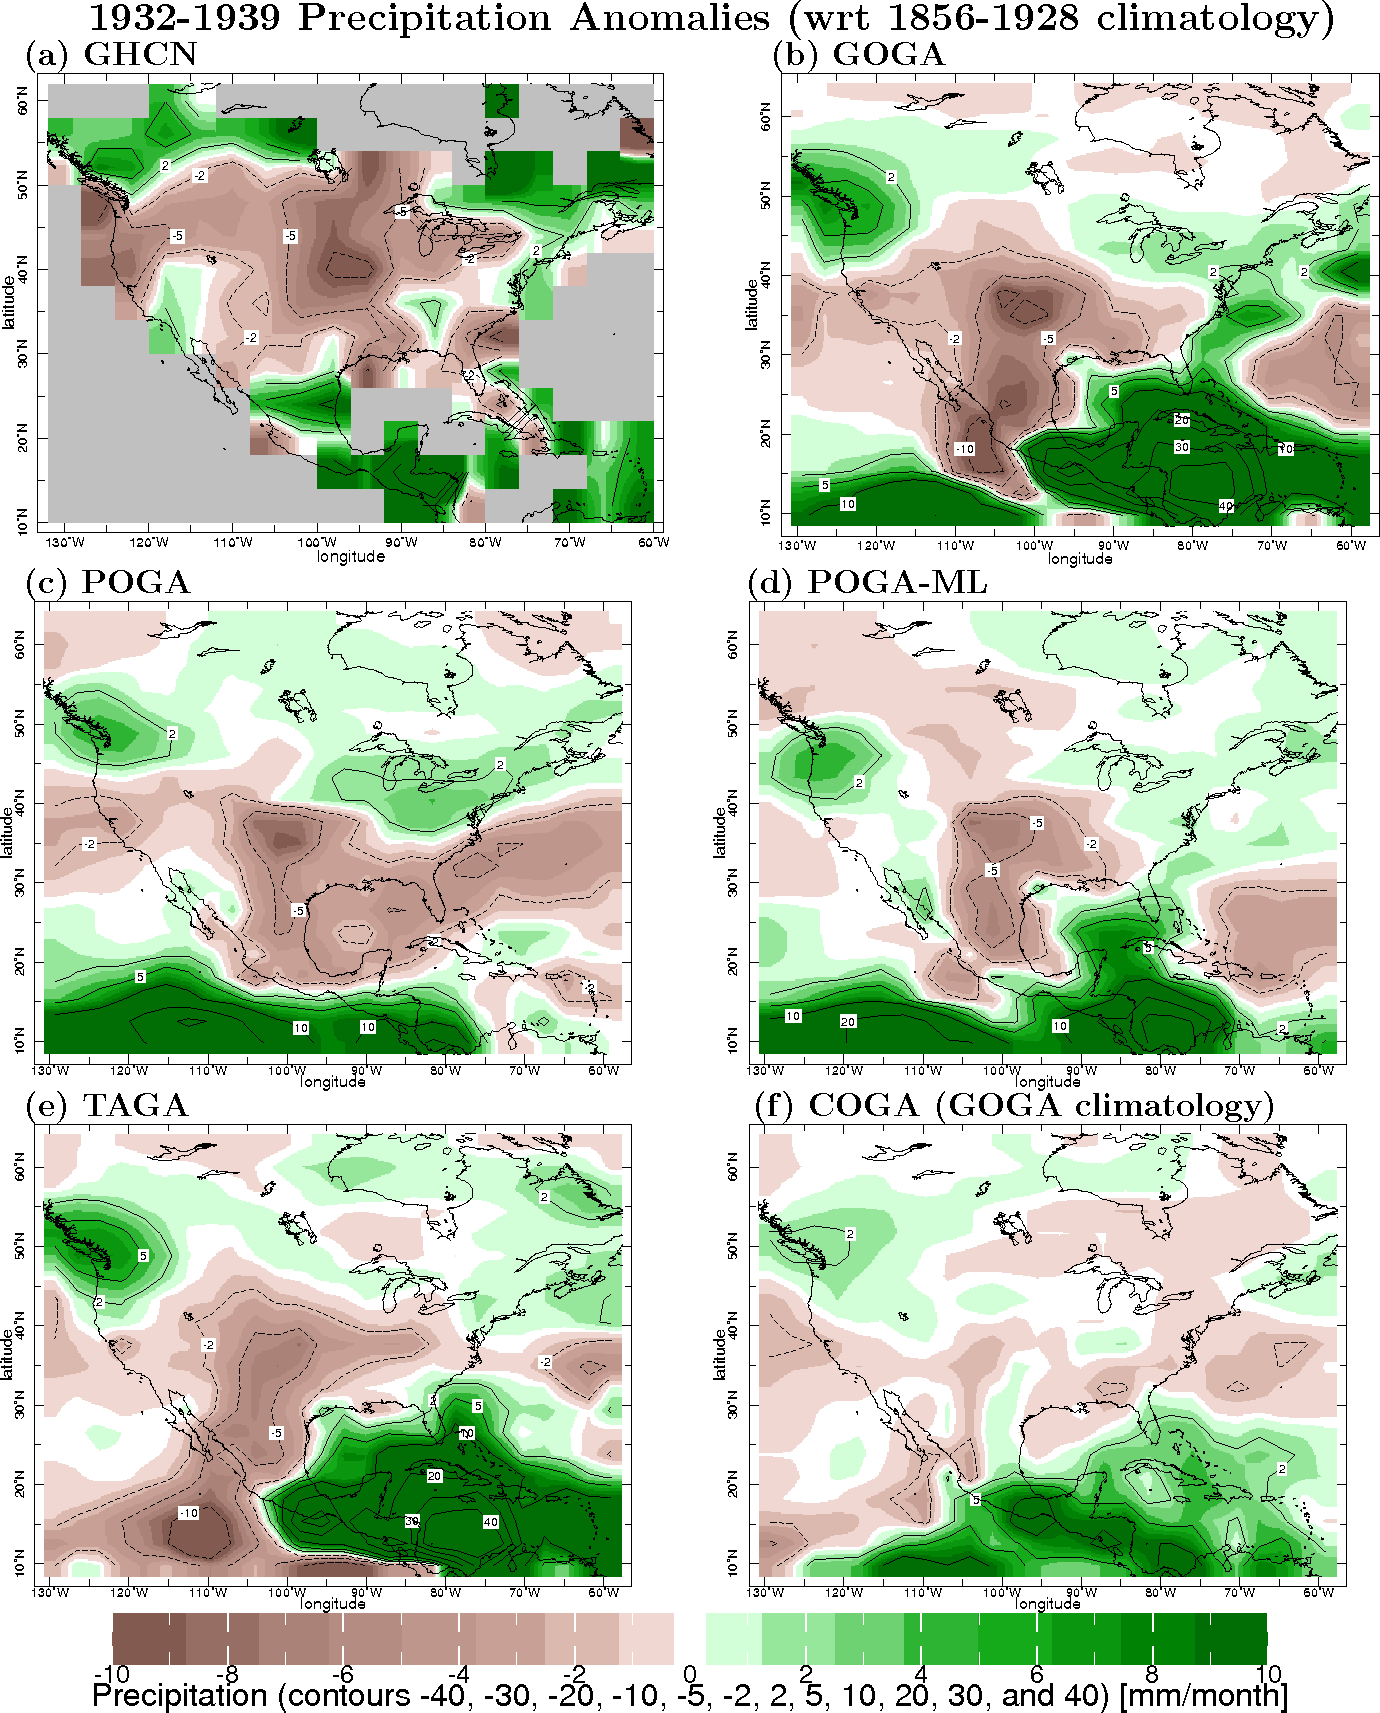
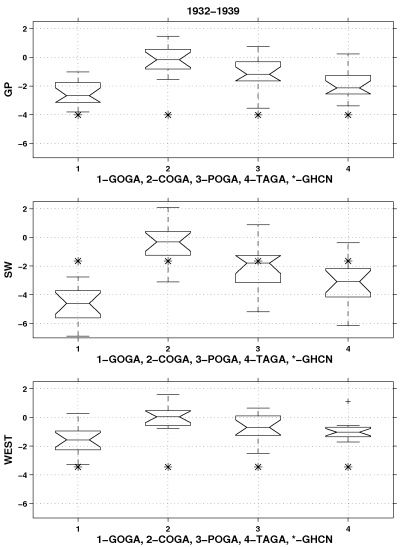
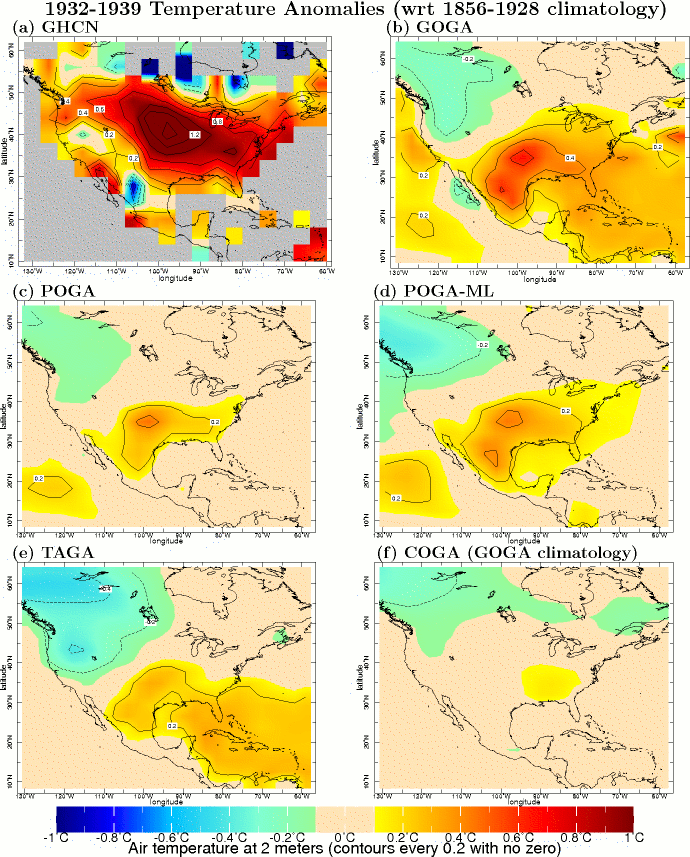
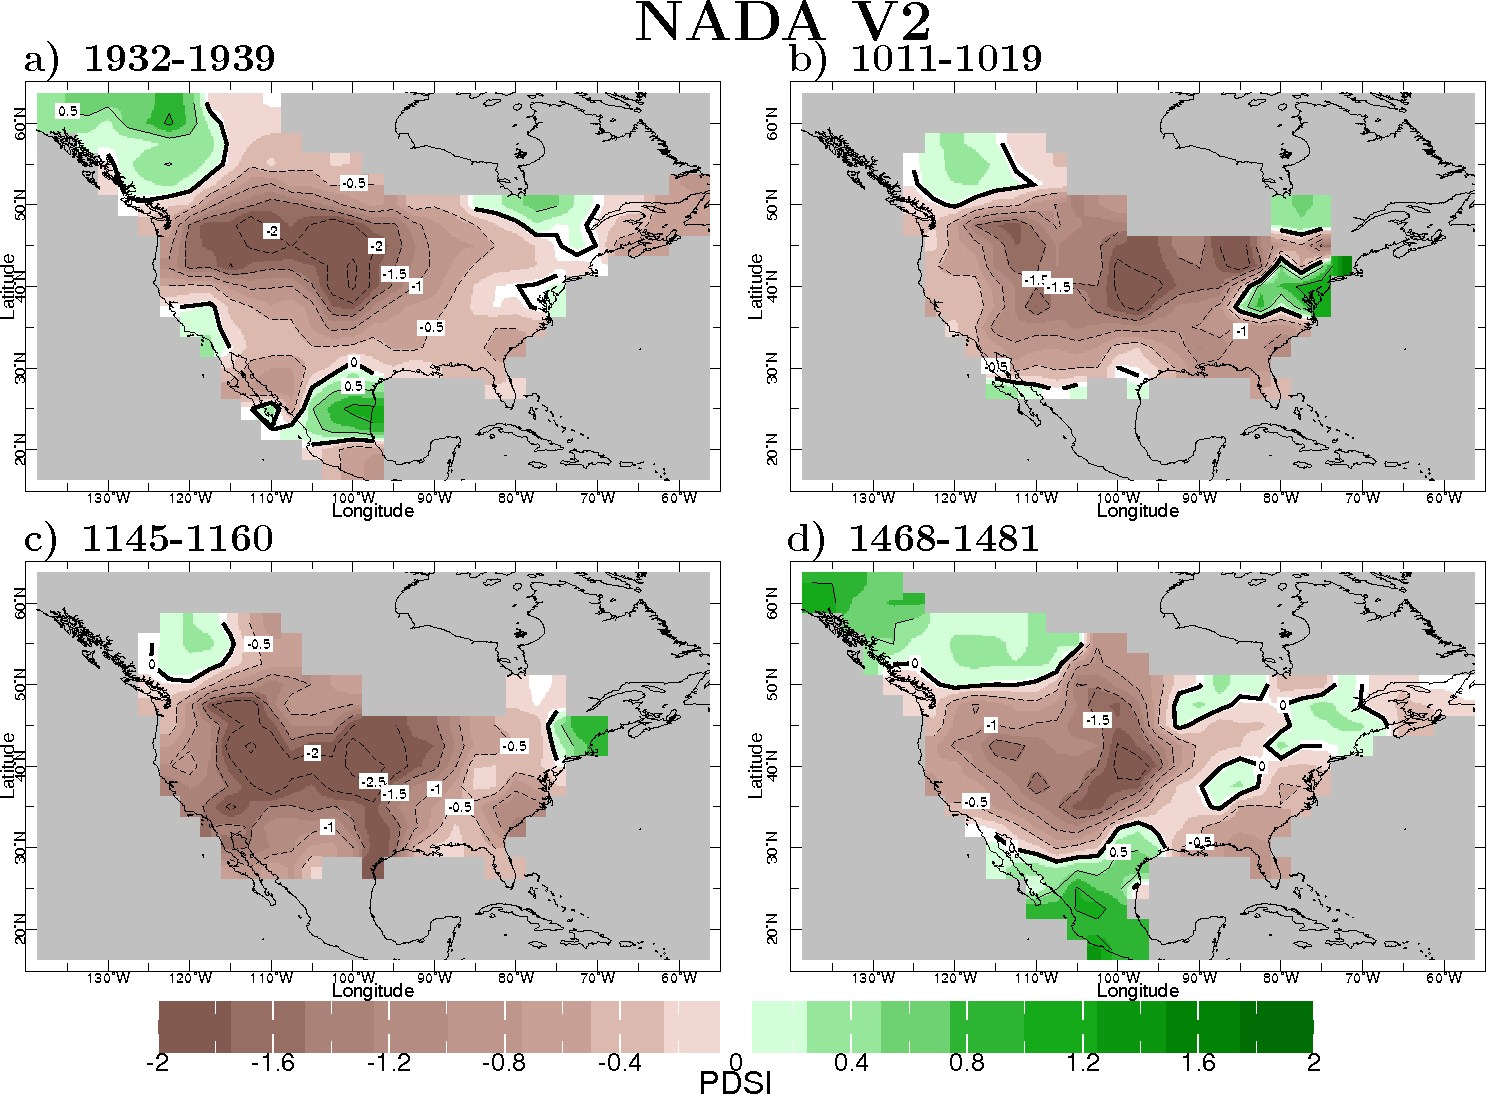
To answer this we compare 16 member ensembles of model simulations of the 1930s forced by historical SSTs variously imposed globally, in the tropical Pacific alone and in the tropical Atlantic alone. These simulations are compared with another ensemble which starts with the atmosphere and land initial conditions in January 1929 (taken from the global SST forced simulations) and integrates forward to 1940 but with the SST climatology of 1856-1928 imposed. This latter ensemble therefore ignores the influence of SST variations in the 1930s and looks to see if some combination of the atmosphere and land initial conditions and internal atmosphere-land variability could have produced a near decade-long drought. Figure 1 shows maps of the ensemble mean precipitation anomaly averaged over 1932 to 1939 relative to the precipitation climatology for that ensemble for 1856-1928. The observed precipitation anomaly 1932-1939 minus 1856-1928 is also shown. The observed precipitation reduction covered most of the United States and was centered in the northern and central Plains. Unlike most historical droughts it also impacted the northern Rocky Mountains states and the Pacific Northwest. The modeled drought with global SST forcing (GOGA) has the right magnitude but was centered and extended too far south and did not impact the Pacific Northwest. The modeled drought was forced by both the tropical Pacific (POGA-ML ensemble) and tropical Atlantic (TAGA ensemble). In contrast, the ensemble with climatological SSTs (COGA) produces largely incoherent and weak precipitation anomalies emphasizing that the real drought was in large part SST-forced. Hence, advance knowledge of SSTs would have led (with this model) to a prediction of a serious drought but one that extended too far south and did not impact the Northwest. Figure 2 shows statistics for the ensemble spread, ensemble mean and observed precipitation averaged over the Great Plains, the Southwest and the entire West (see caption for details). The ensemble with climatological SSTs produced precipitation anomalies that are not separated from climatology. In contrast the ensembles with SST forcing produce droughts that are well separated from climatology though clearly too strong in the Southwest and not strong enough in the West as a whole. Both Pacific and Atlantic SSTs contributed. Figure 3 shows maps for the surface air temperature anomaly. All the model simulations miss the remarkable extent and strength of warm anomalies in the 1930s. The observed warm pattern closely follows the pattern of precipitation reduction and is most likely a response to it. Thus the temperature prediction error follows from the precipitation prediction error. (As support for this, during the 1950s drought the model simulated quite realistic patterns of both precipitation reduction and temperature increase and again their patterns coincide.) The curious spatial pattern of the Dust Bowl drought No model ensemble member produced a spatial pattern of drought akin to that observed during the Dust Bowl. That is, no mix of SST-forcing and internal variability was able to produce a Dust Bowl-like drought. Instead the model produces droughts centered in the Southwest and the southern and central Plains. These are the regions most connected, via atmospheric circulation, to tropical Pacific and Atlantic SST anomalies. That pattern of teleconnections is quite similar to what can be deduced from observations and, hence, the northern and northwestern parts of the Dust Bowl drought are hard to explain in terms of SST forcing alone. Other models (NSIPP, GISS, GFDL), to the best of our knowledge (since only one is published), also produced Dust Bowl droughts centered too far south. The 1950s drought is one that was centered in the regions of strongest teleconnection to tropical SSTs. The inability to correctly model the spatial pattern of the Dust Bowl drought, and its deviation from the typical pattern of tropical SST-forced drought, makes us wonder how unusual the Dust Bowl pattern was. Analyses of instrumental data since the mid nineteenth century - shows that none of the other five multiyear droughts in this interval (1856-65, 1870-77, 1890-96, 1948-57 and post 1998) had a similar pattern. For a longer record we examined the updated version of the gridded tree ring records within the North American Drought Atlas. Computation of the spatial correlation between the Dust Bowl pattern and six year low pass filtered data revealed only three prior droughts that had an anomaly correlation exceeding 0.4 (Figure 4). All were in the Medieval period. No other droughts had an AC exceeding 0.31 presenting a clear separation between Dust Bowl type droughts and the more commonly occurring pattern with a center in the Southwest and southern and central Plains.
Summary
References:
|
|
||||||
LDEO home | search | ocp webmaster
Copyright © 2011 by The Trustees of Columbia University in the City of New York, Lamont-Doherty Earth Observatory.
All rights reserved.
