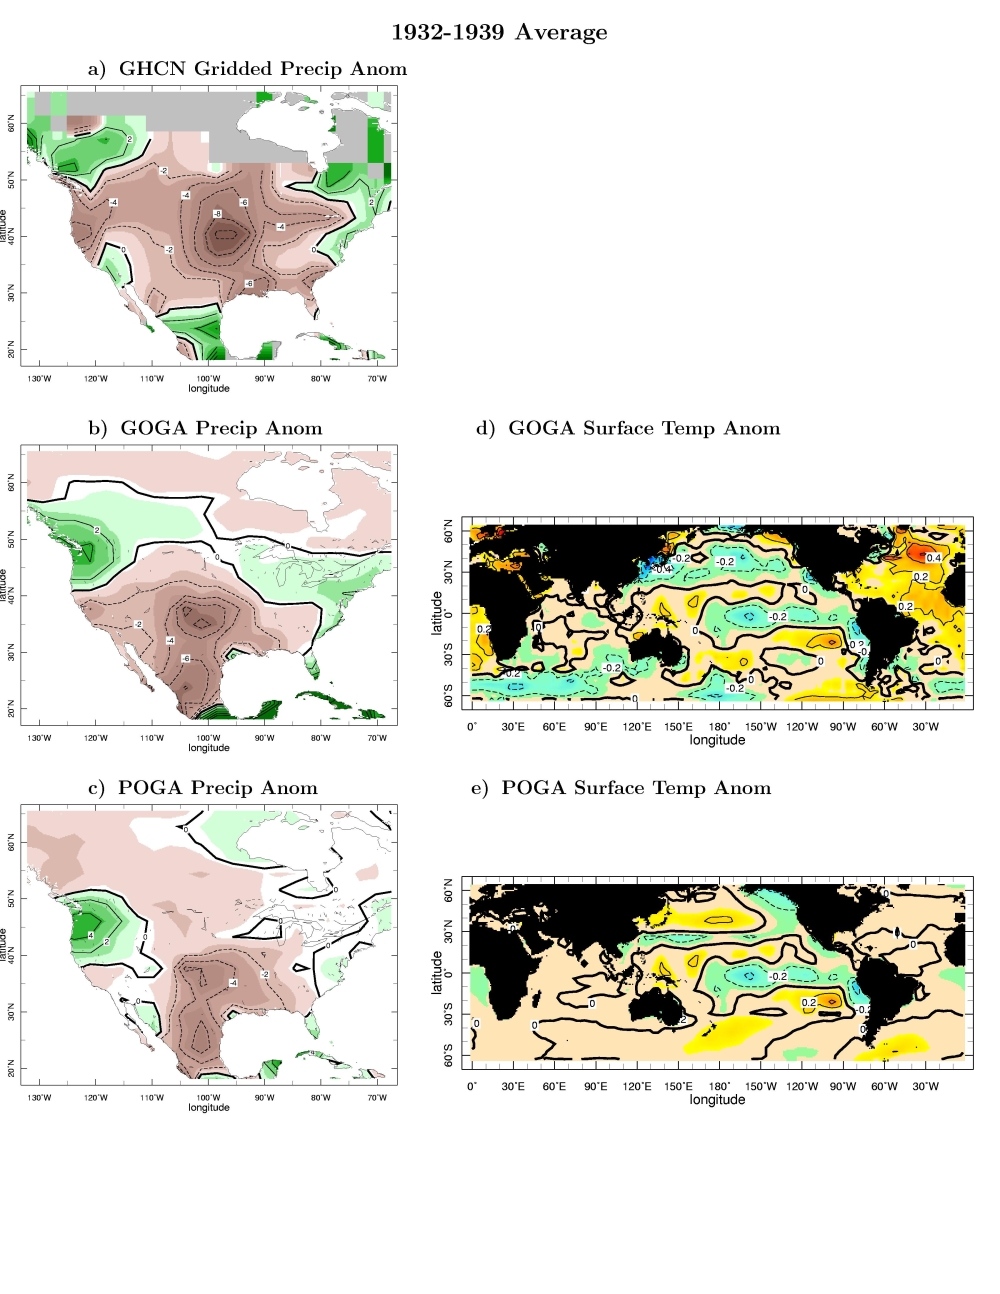
| Figure 3 |
| Observations and model simulations of the 1932 to 1939 Dust Bowl drought. (a) The observed precipitation anomaly for the 1932 to 1939 period, (b) the precipitation anomaly from the GOGA ensemble, (c) the precipitation anomaly from the POGA-ML ensemble, (d) the observed SST anomaly and (e) the SST anomaly from the POGA-ML ensemble. Precipitation units are mm per month and SST units are degrees Centigrade. |

|