 |
|
LAMONT-DOHERTY EARTH OBSERVATORY THE EARTH INSTITUTE AT COLUMBIA UNIVERSITY |
|
| Drought Research | |

|
Recent additions to these pages:
For year after year across vast areas of North America rainfall was low. Summers were parched and the heat excessive. Plants withered and sand dunes moved freely across a formerly green landscape. Human settlements had to be abandoned and populations migrated, forcing social change. By some measures the drought lasted more than a decade.
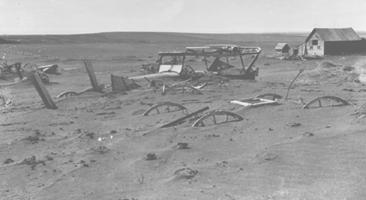
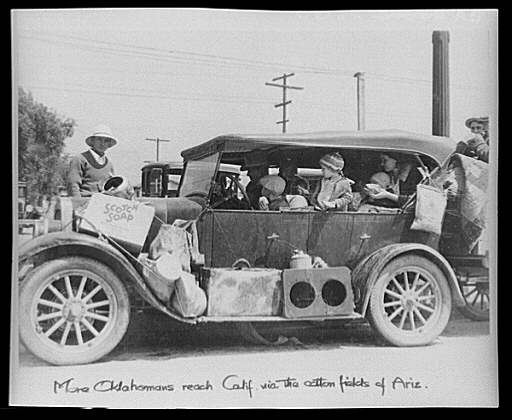
No, this is not a description of the Dust Bowl drought of the 1930s but of the truly severe drought of the late thirteenth century, which coincided with the end of the Anasazi civilization. It could just as easily describe the severe drought of the late sixteenth century. Or it could describe the droughts of the mid-Holocene which so taxed the indigenous peoples of the Great Plains. It is now clear that most of North America has, over the last millennium and throughout the Holocene, experienced prolonged droughts and pluvials equal or more extreme, and as long as or longer than, those in the Twentieth Century. The causes of these droughts and pluvials are unknown. We have only a murky idea of what is in store in the greenhouse future, but if we can understand the late Holocene hydrological history we will be in a better position to predict and understand future changes in hydrological conditions which could have important consequences for water resources, crops and rangelands. Precipitation over North America has been highly variable. In recent years most of the United States experienced drought after 1998 and while this was broken, with a vengeance, in the east towards the end of 2002, dry conditions persisted further west until the current winter. As a result, and as reported recently by the New York Times, beef prices reached new highs (with an assist from the Atkins diet). In the 1950s vast areas of the southwest of the United States were dry, an area south of the area effected by the 1930s drought. In contrast the first two decades of the Twentieth Century were very wet across the western United States. Since this period was the time of water resource planning for the West the perception of water abundance led to decisions being made that were clearly less appropriate in the dry decades to follow. Going further back in time there is evidence of frequent and extensive droughts in the Nineteenth Century, including dune activation at the time of European exploration of the West and earlier in the millennium and a `megadrought' in the late sixteenth century. These droughts still lasted decades and with precipitation reductions comparable to those experienced in the last century. However, there is tantalizing evidence of a regime shift around 1300 with the period from 800 to 1300 being substantially - and continually - drier than the period after. Curiously enough this coincides with the Medieval Warm Period and is suggestive of a reorganization of the global climate somewhere around 1300 (give or take several decades) and transition into the Little Ice Age. During the 1930s, at the heart of the Great Depression, one of the greatest population movements in United States history occurred. About one third of a million rural people from the Great Plains headed west to seek land and work in California. They had been driven out by a harsh combination of social, economic and climate forces. A chronic drought had settled on the area, which persisted for a decade with only brief spells of normal rain. The drought-prone wheat that the farmers had planted shriveled and died. Ploughs had torn out the native, drought resistant, prairie grass in the preceding years of ample rain and food demand. Winds tore at the bare soil removing valuable topsoil in `black blizzards' and dumped it as far away as Washington DC and even Norway. As land values plummeted large land owners bought up land and moved in tractors evicting poor farmers and destroying their small farms. Many of the Plains poor, after first experiencing appalling living conditions and ruthless exploitation at the hands of large California growers, ended up doing their part to defeat fascism working in the armaments factories and shipyards of the West Coast during World War II. The American West was a very different place before and after the Dust Bowl.
The Dust Bowl drought of the 1930s is the most famous of the persistent American droughts, both because of its social importance and because it has been memorialized in some of the greatest works of American culture by John Steinbeck, John Ford, Dorothea Lange and Woody Guthrie. But it is not the only, and perhaps not even the most severe, drought that has occurred in the relatively short period of European settlement. The Southern Plains and the Southwest experienced another severe drought in the 1950s and the entire West experienced a drought from 1998 until the summer of 2004 and it may yet return. Tree ring records tell us that a drought from the mid 1850s to the mid 1860s was even more severe in the Plains than the Dust Bowl drought but, because the area was still under prairie grass, the environmental effects were less severe. During the earlier period of Indian settlement even more severe droughts occurred that had their own severe impacts on human populations. Since the early Nineteenth Century persistent droughts have been interspersed with persistent wet periods called `pluvials'. One of these occurred in the first two decades of the Twentieth Century and, ironically, preceded the Colorado River Compact that divided up the river flow between the states of the southwest on the basis of an anomalously high flow. The period between 1977 and 1998 was also anomalously wet and was, perhaps, the wettest two decades of the last millennium in Arizona. Also ironically, this coincided with a huge population growth in the desert states of the Southwest.
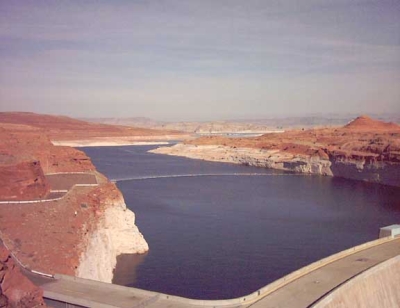
In developing countries, such as those in Sahelian Africa, drought can immediately cause death and colossal suffering. In rich countries such as the United States the effects of droughts are different. No one will starve as a result of continued drought in the West. But over the Twentieth Century the West has emerged into the most advanced civilization the world has ever seen to be based on irrigation and water resource engineering. Plumbing on a continental scale supports massive agricultural, industrial and cultural production. Just how vulnerable is such a complex water-dependent society in an arid region to climate change? We do not know because we have not been at this point before but, as man changes the climate, we may be about to find out.
Physical causes of persistent droughts: forcing of atmosphere circulation anomalies
by tropical Pacific surface ocean temperature variability
The causes of persistent droughts and pluvials over North America are still, ultimately, in question. But in the last few years scientists at, first, NASA's Goddard Space Flight Center and, second, the Lamont-Doherty Earth Observatory of Columbia University have demonstrated that they are caused by subtle changes in sea surface temperatures (SSTs) of the tropical oceans, especially the tropical Pacific Ocean. Exactly why tropical SSTs should have this impact on precipitation in remote regions of the planet is easily understood. The warmest SSTs in the world occur in the tropics and have warm and moist air above. If air is warm and moist it tends to rise, the water vapor within it condenses and heats the air by latent heat release. The heating is balanced by expansion of air as it moves up to lower atmospheric pressure. The warmest regions of the planet are potent heat sources for the global atmospheric circulation that, in combination with regions where the atmosphere is cooled (for example, by radiation to space over winter continental interiors), drive wind circulations that have global reach. The strongest heat sources are over the tropical west Pacific Ocean, central Africa, the Amazon, the summer monsoons and a globe-encircling near-equatorial strip called the Intertropical Convergence Zone (ITCZ) that lies above the warmest SSTs.
Tropical SSTs vary all the time. On the timescale of years to years, the eastern and central equatorial Pacific Ocean warms and cools as part of the El Niño-Southern Oscillation (ENSO), fundamentally a consequence of wind-driven ocean motions that redistribute the heat within the ocean. This causes eastward and westward shifts of the west Pacific warm pool and northward and southward shifts of the ITCZ. During the warm phase of ENSO, El Niño, the tropical troposphere also warms, as heat is released from the ocean, and it cools during the cold phase, La Niña. La Niña events are typically associated with dry winters in the southwest and also dry springs in the Plains. If they persist into summer they can also cause dry summers in the same regions. On the year to year timescale there are two basic reasons why cold tropical Pacific SSTs cause reduced precipitation over North America (and warm tropical Pacific SSTs cause increased precipitation). The cold waters cause a weaker than usual loss of heat from the ocean to the atmosphere and the entire tropical troposphere cools. This reduces the gradient in atmospheric pressure, at any level, between the tropics and the mid-latitudes causing the subtropical jet streams, in both hemispheres, to weaken and move poleward. This change in the winds blowing from west to east in the upper levels of the troposphere has an impact on how the weather systems - the ones that bring us the daily variations of weather - propagate within the atmosphere in much the same way that changes in the depth of the sea impact the propagation of waves at the sea surface. When the subtropical jets are weaker and more poleward the weather systems deposit their momentum further poleward than usual which has to balanced by a compensating shift in another part of the atmospheres momentum balance, in this case by an induced poleward flow. The poleward flow causes convergence of mass in the part of the upper troposphere to which it is flowing and there the air must descend, reaching down to the surface. Precipitation only occurs when air is moving up and moisture is condensing so the induced descending motion quite effectively reduces precipitation and causes drought. For a more detailed description of these interactions, see the new page on the North Pacific storm track here. The second way in which cold equatorial Pacific waters cause drought over North America is by shifting the location of the heat sources in the tropics. When the equatorial Pacific waters are cold the ITCZ moves north to warmer waters and, since this heating distribution drives a sizable part of the global circulation, winds are changed around the world. Once more the altered circulation places anomalous descending motion over western North America and again suppresses precipitation. Although the link between ENSO and North American precipitation had been observed and simulated by weather prediction and climate models for several years, the link on longer timescales was established only recently. This is in large part because until recent years, and rather remarkably, all climate modeling groups began their historical simulations no earlier than 1950. This was largely because upper air observations (from weather balloons), which are used to verify model simulations against, are extensive only after that time. Such a short period does not encompass entirely a single major drought. However SST observations begin in 1856, immediately after an agreement between the navies of the world, merchant and military, to routinely take measurements at sea. Data is sparse in the Pacific Ocean in the Nineteenth Century but the trade of the European empires guaranteed good coverage in the Indian and Atlantic Ocean. Advanced statistical methods, and knowledge of the spatial patterns of climate variability that can be gained from the more recent period of extensive data coverage, can be used to `fill in the gaps' and prepare near global maps of SSTs on a monthly basis from 1856 on. The NASA climate modeling group began their historical simulations in 1930 while our group at Lamont began simulations in 1856. The observed SSTs are used as the surface ocean boundary condition that the atmosphere model responds to. The climate model simulations performed at Lamont which begin in 1856 have allowed the first integrated model/observations/proxy reconstruction analysis of North American hydrolcimate in the mid to late nineteenth century, a period that experienced three severe droughts, each of which had important environmental consequences. For more click below. The modeling strategy used by all climate modeling groups is to generate ensembles of simulations and then average across the ensemble to isolate the signal that is forced by the imposed SSTs. Each ensemble member is begun (say, in January 1856) with a different state of the model atmosphere. As such, each ensemble member contains a different sequence of weather that is uncorrelated with that in any other ensemble member. When the ensemble is averaged together, and provided there are enough ensemble members, the weather noise goes away leaving behind the component of the ensemble simulations that was forced by the common SST boundary conditions. When the model ensemble mean looks like what occurred in Nature then, barring some extraordinary fluke, it indicates that the real world event, say, a drought, was forced by the imposed SSTs. By only imposing SSTs in specific regions of the world ocean we can determine which SSTs were responsible. This approach is illustrated in the plot of time series shown in Figure 1. In the top panel the solid curve is the time series of the observed precipitation in the Great Plains region (30-50N,110-90W) taken from station data, and the dashed curve is the ensemble mean of a model in which only the tropical Pacific SSTs were imposed (and the model computed SSTs elsewhere according to physics of surface air-sea heat exchange, called POGA-ML for Pacific Ocean-Global Atmosphere-Mixed Layer ocean). The gray area around the dashed curve contains the plus and minus of two standard deviations of the spread of the precipitation simulations within the ensemble. The time series have been filtered to remove year to year variability but retain variability with periods longer than six years.
Figure 1
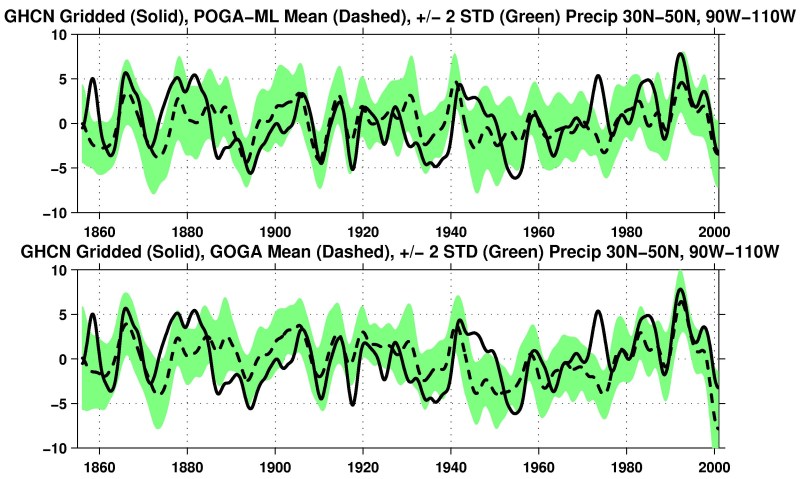
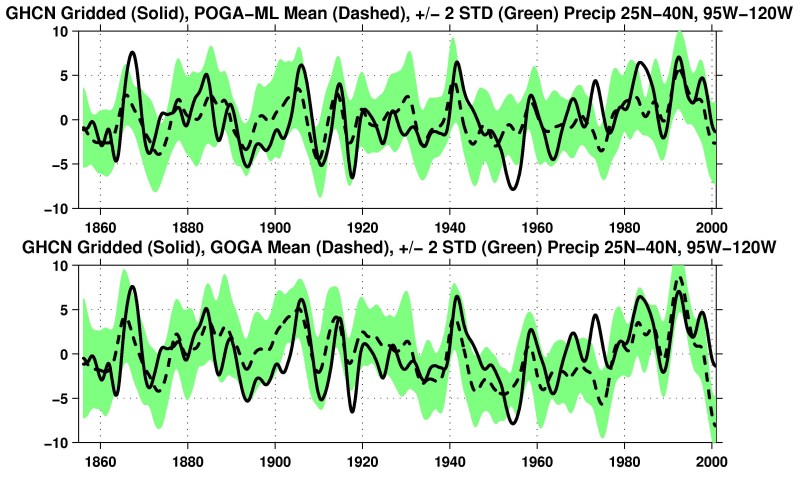
Even though there is very little station data in this region prior to around 1900, the agreement between the model simulation and the observations is striking throughout the whole 1856 to 2000 period. The strong variability of precipitation in the 1800s (including droughts in the 1850s to 1860s, the 1870s and the 1890s) is captured by the model as well as a dry period in the 1930s (the Dust Bowl), another in the 1950s, a wet period after 1977 - and especially in the 1990s - and a return to drought afterwards. In the lower panel the dashed curve shows the ensemble simulations when the SSTs are specified everywhere around the world ocean (called GOGA for Global Atmosphere-Global Ocean). That the models simulation in this case is very similar to that when only the tropical Pacific SSTs are specified testifies to the dominance of forcing from the tropical Pacific. The agreement is just as good when we look at the southwest region, shown in Figure 2. Those unfamiliar with climate modeling may be unmoved by the degree of agreement between model and data but, given the amount of random variability there is in the atmosphere on all timescales, the level of agreement shown is quite amazing. Remembering that the ensemble mean contains only that part of the model simulations that is responding to the imposed SSTs, apparently all the major events of the American West's hydrological history in the last century and a half were forced by slowly varying tropical Pacific SSTs.
Figure 2
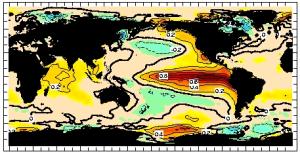
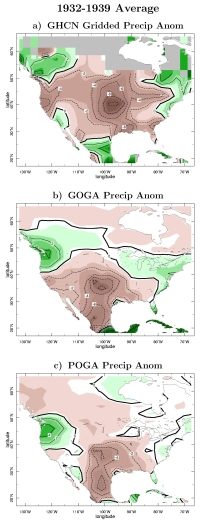
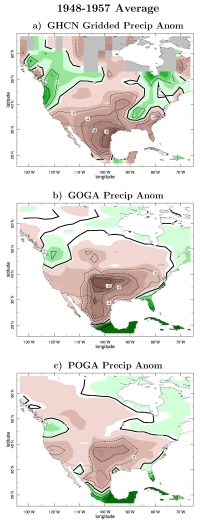
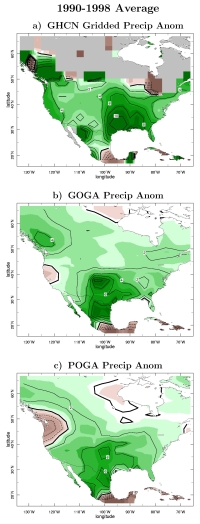
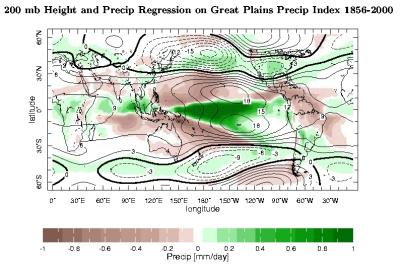
Figures 3, 4 and 5 illustrate this result for two specific droughts - the Dust Bowl drought of the 1930s and the 1950s drought - together with the pluvial (wet spell) of the 1990s. The figures show the observed drought, the drought modeled by both the model with SSTs specified everywhere (GOGA) and the model with only tropical Pacific SSTs specified (POGA-ML), and also the SSTs from each model, all averaged over the entire period. The spatial patterns of the modeled droughts are very similar to what actually occurred with the droughts affecting the Plains, the U.S. southwest and northern Mexico and other regions of the United States being either less affected or modestly wetter than usual. The severities of the modeled droughts are also reasonable. These general statements follow, with opposite sign, for the 1990s pluvial too. The spatial patterns of each drought and pluvial, and for both model configurations of SST forcing, are very similar suggesting a common cause, the tropical Pacific forcing. The SST anomalies responsible are very small. During the Dust Bowl and 1950s droughts the tropical Pacific Ocean was cooler than usual by only a few tenths of a degree Centigrade while in the 1990s it was warmer by about the same amount (in addition to a more spatially uniform global warming). Typical El Niño and La Niña SST anomalies are about two degrees Centigrade and cause precipitation anomalies over North America much larger than the decadal timescales droughts and pluvials. The persistent droughts are the sum effect of persistent, but small, precipitation anomalies. During the Dust Bowl precipitation over the Plains was reduced by about 15% but, when this happens year after year, the ground moisture gets less and less as evaporation proceeds, resulting in severe drought. When drought strikes North America it does not do so in isolation but fits into a global pattern of precipitation variability with drought elsewhere in the world while others regions get more precipitation. Figure 6 shows the global spatial pattern of satellite-observed (1979 to current) precipitation variability that goes along with a typical El Niño event and Figure 7 shows the spatial pattern that goes along with a persistent wet period in the Great Plains as given by the ensemble mean of our simulations from 1856 to 2000. The latter map also shows the spatial patterns of upper tropospheric geopotential height, a measure of the temperature of the troposphere between there and the surface. (All patterns were found by linear regression of the illustrated quantity on time series of either ENSO activity or Plains precipitation.)
During El Niño events the entire tropical troposphere is warmer than usual while the mid-latitudes are cooler than usual. There is increased precipitation in the tropical Pacific Ocean but reduced precipitation across the mid-latitudes of each hemisphere. Thus, on the year to year timescale, when it is wet in the American West it is also wet across the Mediterranean and into Asia and wet in mid-latitude South America. The pattern is very similar to the one the climate model produces for much longer term - decade to decade - precipitation variability. Persistent drought, for example, in the American West should be synchronous with droughts in mid-latitude South America, the Mediterranean and Asia, which, it turns out, is the case. Mechanistically this occurs because the change of temperature of the entire tropics, associated with changes of tropical Pacific SSTs, means that the subtropical jets change in strength and latitude at all longitudes and in both hemispheres. Thus the propagation of weather systems is also affected at all longitudes and their momentum deposition creates a tendency for descent (for drought) or ascent (for pluvials) at all longitudes in the mid-latitudes and in both hemispheres. Having established that gradual changes in tropical Pacific SSTs, on the timescales of years to decades, cause the droughts and pluvials over North America via the impact they have on the atmospheric circulation, we need to know what causes the SST changes. According to other work conducted at the Lamont Doherty Earth Observatory, the decadal timescales variations of tropical Pacific SSTs could be caused by coupled interactions between the tropical Pacific atmosphere and ocean. The dynamics of the ocean respond over timescales that range from months to many years to changes in surface wind stress. As the ocean dynamics respond they redistribute heat around the tropical Pacific Ocean creating SST anomalies. The atmosphere above the tropical Pacific Ocean responds to the SST anomalies creating further wind stress anomalies that the ocean then responds to. The tropical Pacific Ocean and atmosphere never reach an equilibrium but engage in a never ending tango that continually creates distributions of tropical surface ocean temperature that, although they tend to repeat themselves, are always subtly different. Because the SST anomalies influence the atmosphere circulation, this tropical atmosphere-ocean coupling also creates an endless sequence of droughts and pluvials over Northern America. El Niño and La Niña events which typically last a single winter, can be accurately predicted in some detail up to one year in advance. This is because the ocean motions that generate SST anomalies (and which are responses to changes in surface wind stress) evolve over months and can be predicted with ocean circulation models. The decadal timescales SST anomalies are caused by the most slowly adjusting parts of the tropical ocean circulation and, to a limited extent, appear predictable years in advance. In the same way that we cannot hope to predict the sequence of weather within a winter but may be able to predict the seasonal mean temperature or precipitation, we will not be able to predict the sequence of El Niños and La Niñas that make up a decade but may be able to predict whether the average SSTs over a decade will be warmer or colder than normal. The climate modeling group at Lamont has conducted experimental hindcasts of past decadal tropical Pacific SST variability and of future variability. We have concluded, tentatively, that the decadal variations are predictable to a modest degree a few years in advance. For example the 1976/77 warm shift of tropical Pacific SSTs that heralded a wet spell over North America was modestly predictable in 1971. We have also predicted that La Niña-like conditions will persist for another decade meaning that we can expect drought to return to the Plains and the West in the next several years. The tropical Pacific SST predictability is modest. However, because decadal timescale tropical SST anomalies cause decadal timescale droughts and pluvials over North America, it suggests that the droughts and pluvials are themselves predictable to some degree. This will become an active area of research for which the Lamont climate modeling group is attempting to seek support from funding agencies.
The model simulations performed have made clear how tropical ocean
surface temperatures drive persistent North American droughts. This
raises the issue of predictability. The question of whether ocean
surface temperatures are predictable beyond the interannual timescale
has hardly been looked at. However the issue of whether, given known
ocean temperatures, a drought could be predicted is one we have addressed
with atmosphere models. For example, we have taken a 1929 perspective
and assessed whether the Dust Bowl could have been predicted in
advance if 1930s ocean temperatures had been foreknown. Before 1900 or so the main source of information on past droughts and pluvials over North America comes from tree rings, the width of which correlates with summer drought intensity. The Tree Ring Laboratory at Lamont has compiled a North American Drought Atlas, using hundred of tree records from across North America, that presents maps of summer drought severity for every year from 2BC to the current. Figure 8 shows the percentage of the area of the American West that is experiencing moderate to severe drought as a function of time. The time series has been filtered to show variations on the multidecadal and longer timescales.
Figure 8
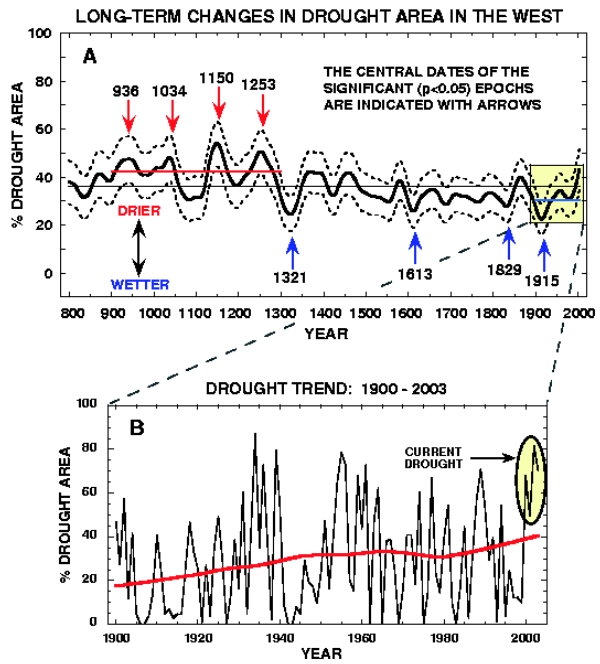
For several hundred years until about 1400AD, at any one time, more of the West was experiencing drought than occurred for centuries after. This has been called a Medieval Megadrought. During Medieval times the American West was an even drier climate than the current already arid one. Apparently this very arid climate greatly stressed the social organization of Indian societies at the time, according to archaeologists. Around about the fifteenth century the climate shifted to being much wetter and remained that way for several hundred years, coinciding with the Little Ice Age, a period when climate was cooler than now around the world. There also appears to have been a return to a more drought-prone climate in the last two centuries. The paleoclimate evidence of past multi-century long droughts raises the question of whether the climate of the American West, either due to natural causes or because of anthropogenic climate change, could ever revert back to that state. If it did the water resources in the West would be severely stretched to the point that social conflict, of some sort, would be inevitable as states and cities and different users argued over diminishing resources. Currently it is unknown what caused the megadrought of the Medieval period. One possibility is that just as decadal droughts are caused by decadal La Niñas, for some reason the tropical Pacific Ocean was colder than now for several centuries. Some support for this comes from reconstructions of SSTs from fossil corals found in the tropical Pacific that show colder conditions at that time. More La Niña-like conditions during the Medieval period could have been caused by greater solar irradiance than occurred in the centuries after. This could have been caused by a maximum in solar activity (sunspots) and limited volcanism. There are so many unsure links in that sequence of events - from sunspots to irradiance to tropical SSTs to drought - that much work needs to be done before we can ever be sure of the causes of the drought. For a more recent, detailed discussion, click [more] For a first attempt to model Medieval megadroughts with coral-reconstructed tropical SSTs as forcing, click [here]. Global average precipitation increases with global warming induced by rising greenhouse gases. This occurs because increased infrared radiation from the atmosphere to the surface has to be balanced by increased surface heat loss, which occurs primarily by increased evaporation. For the global average increased evaporation must be balanced by increased precipitation. However, regionally, precipitation can be reduced as a consequence of greenhouse climate change. This occurs because rising atmospheric humidity causes the atmospheric hydrological cycle to intensify, increasing water vapor transports and making wet areas wetter and dry areas drier. This mechanism has been discussed by Held and Soden (J. Climate 2006). Further a poleward expansion of the Hadley Cell and a poleward shift of the mid-latitude storm tracks expands the subtropical dry zones poleward. These processes cause the subtropics in general to dry and expand poleward as a consequence of global warming. Southwestern North America is one region projected to dry, beginning now (see An imminent transition to a more arid climate in southwestern North America). For the American West there is the additional question of whether rising greenhouse gases will induce an El Niño-like or La Niña-like response in the tropical Pacific. The former will mean increased precipitation and the latter decreased precipitation in addition to the drying induced by changes in the hydrological cycle and circulation responses as a response to overall warming. Currently climate models are all over the map in how the tropical Pacific Ocean responds to rising greenhouse gases. The climate modeling group at Lamont has argued that rising greenhouse gases will warm the western tropical Pacific Ocean by more than the eastern ocean because, in the west, the increased downward infrared radiation has to be balanced by increased evaporative heat loss but in the east, where there is active upwelling of cold ocean waters from below, it is partially balanced by an increase in the divergence of heat by ocean currents. As such, the east to west temperature gradient increases and a La Niña-like response in induced. This is the same argument for why, during Medieval times, increased solar irradiance and reduced volcanism could have caused a La Niña-like SST response, as seen in coral based SST reconstructions. If the Medieval period is any guide as to how the tropical Pacific Ocean and the global atmosphere circulation respond to positive radiative forcing then an induced La Niña could regionally intensify the general projected subtropical drying and the American West could be in for a future in which the climate is more arid than at any time since the advent of European settlement.
This research was supported by the National Science Foundation and
under the Cooperative Institute for Climate Applications and Research
(CICAR) award number NA03OAR4320179 through the Abrupt Climate Change Studies (ARCHES)
and CLIVAR (through 2004 and from 2006 to present) programs of the National Oceanic and
Atmospheric Administration, U.S. Department of Commerce. The
statements, findings, conclusions, and recommendations are those of
the author(s) and do not necessarily reflect the views of the National
Oceanic and Atmospheric Administration or the Department of Commerce.
Drought research team at Lamont:
Richard Seager, Yochanan Kushnir, Ed Cook, Huei-Ping Huang, Mingfang Ting, Naomi Naik,
Jennie Nakamura, Celine Herweijer, Mark Cane
Collaborators: Nili Harnik (University of Tel Aviv), Walter Robinson (University of Illinois), Amy Clement (University of Miami), Rob Burgman (University of Miami), Isaac Held (GFDL), Gabriel Vecchi (GFDL), Gabriel Lau (GFDL), Jian Lu (NCAR)
Richard Seager's Powerpoint Presentation to the New York Academy of Sciences on Oct. 18, 2005 can be downloaded HERE.
Publications:
The following research papers on North American drought and its global context can be downloaded:
|
|
|||||||||||||||

LDEO home | search | ocp webmaster
Copyright © 2011 by The Trustees of Columbia University in the City of New York, Lamont-Doherty Earth Observatory.
All rights reserved.