 |
|
LAMONT-DOHERTY EARTH OBSERVATORY THE EARTH INSTITUTE AT COLUMBIA UNIVERSITY |
|
| Drought Research | |

|
The characteristics and likely causes of the Medieval megadroughts in North America
Severe though the six multiyear droughts since the mid nineteenth century have been in terms of environmental and social impacts, as climate events they were dwarfed by a series of megadroughts that struck the West between about 900AD and 1400AD. These droughts were sufficiently long in duration that it actually makes more sense to describe the Medieval climate of the West as not so much afflicted by a sequence of droughts but as simply more arid than in subsequent centuries or now.
The visual evidence of medieval megadroughts in the landscape today
The medieval droughts were long before the beginning of instrumental weather records and their character and severity must be reconstructed from the signature they left within the environment. One of the most dramatic of these is frequently seen by travelers in the mountains states of the West who probably rarely understand what they are seeing. Dead tree stumps, seasonally flooded by water, are often seen in river valley bottoms in the Sierra Nevada and they also populate the underwater margins of famous lakes such as Mono Lake. In the early 1990s Scott Stine, a University of California geographer, began using carbon dating to determine when these trees were living and found that they pretty much all grouped in the medieval period. See Scott Stine's article at www.yosemite.org. The trees were living in river valleys and around lakes that, because the climate was drier, never flooded. When the medieval megadrought period ended, waters rose and the trees died. Elsewhere in the high plains of Nebraska and elsewhere the medieval megadroughts can still be seen as massive sand dunes that are now grassed over and stable. In a remarkable paper ('Late Quaternary bison population changes on the southern Plains', Plains Anthropologist, v 19, 180-196, 1974), Tom Dillehay successfully sketched the medieval climatological history of the southern Great Plains based on little more than the numbers of bison bones found in archaeological sites. At this time few Indians were dependent on bison hunting - that was yet to come when European expanded into the moister areas to the east and displaced Indians from areas where they both farmed and hunted. In Dillehay's study it is striking how few were the bison remains a millennium ago compared to the periods before and after. He also drew what now appears the correct conclusion - the climate was drier and bison populations shrank as grasslands became desert. The medieval megadroughts may also have left their signature on the human environment of the West. The great cliff cities in the four corners region of the West such as at Chaco Canyon and Mesa Verde were all abandoned towards the end of the drought. These societies were based on irrigated agriculture. Although there remains much debate about why these highly organized Indian societies collapsed archaeologists are revisiting the idea that decades of dry conditions were part of the reason (see Jones et al. 'Environmental Imperatives Reconsidered: Demographic Crises in Western North America during the Medieval Climate Anomaly, Current Anthropogy, April 1999, ). By the time wetter conditions returned the Spaniards had also arrived and probably prevented Indians from reestablishing irrigation-based complex urban societies.
Tree ring records of the spatial extent, severity and duration of droughts
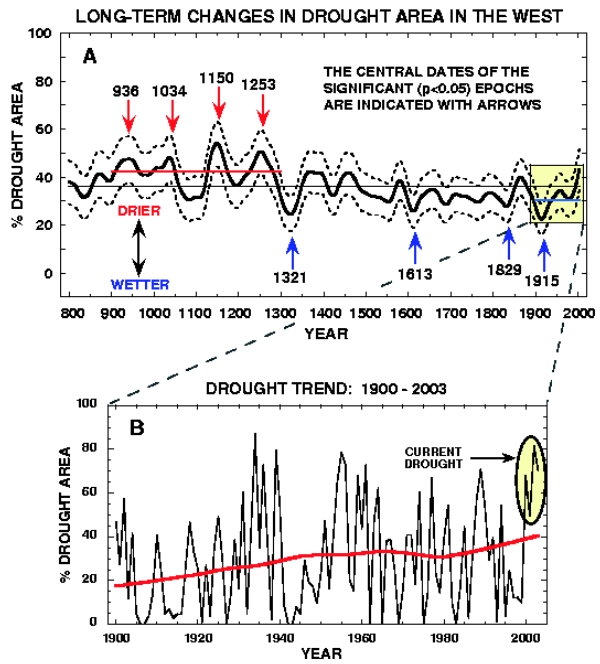
The best record of the droughts come from the width of annual growth rings of long lived trees. Correlation of modern day ring widths with weather records has demonstrated that the ring width is strongly related to summer values of the so-called Palmer Drought Severity Index or PDSI. The PDSI was developed as a simple measure of the moisture content of soil in the root zone. It makes sense that the tree ring width would correlate with this during summer since that is the growth season. Analysis of ring widths from living trees that have lived in North America for as long as two millennia, together with plenty of complex statistics, allows preparation of maps of summer PDSI for each year from 2BC to now. This data set was developed at the Tree Ring Laboratory at Lamont-Doherty Earth Observatory and is called the North American Drought Atlas (NADA). For the early centuries the coverage is limited to areas of the West with very long lived trees but by the beginning of the medieval droughts the coverage is pretty much all of the current United States. In 2004 Ed Cook, of the LDEO Tree Ring Lab, published the first results from the NADA. One figure, reproduced here (Figure 1), of the percentage of the American West at any time effected by severe drought made a clear case for elevated aridity during the medieval period. For several hundred years up until the 15th Century well over half the area routinely experienced severe drought at any time. The centuries to follow - broadly coincident with the Little Ice Age period of a colder climate in Europe - was wetter. There is a hint that we have been returning to a more arid climate since the beginning of the Nineteenth Century.
Figure 1
Tree ring records of modern droughts
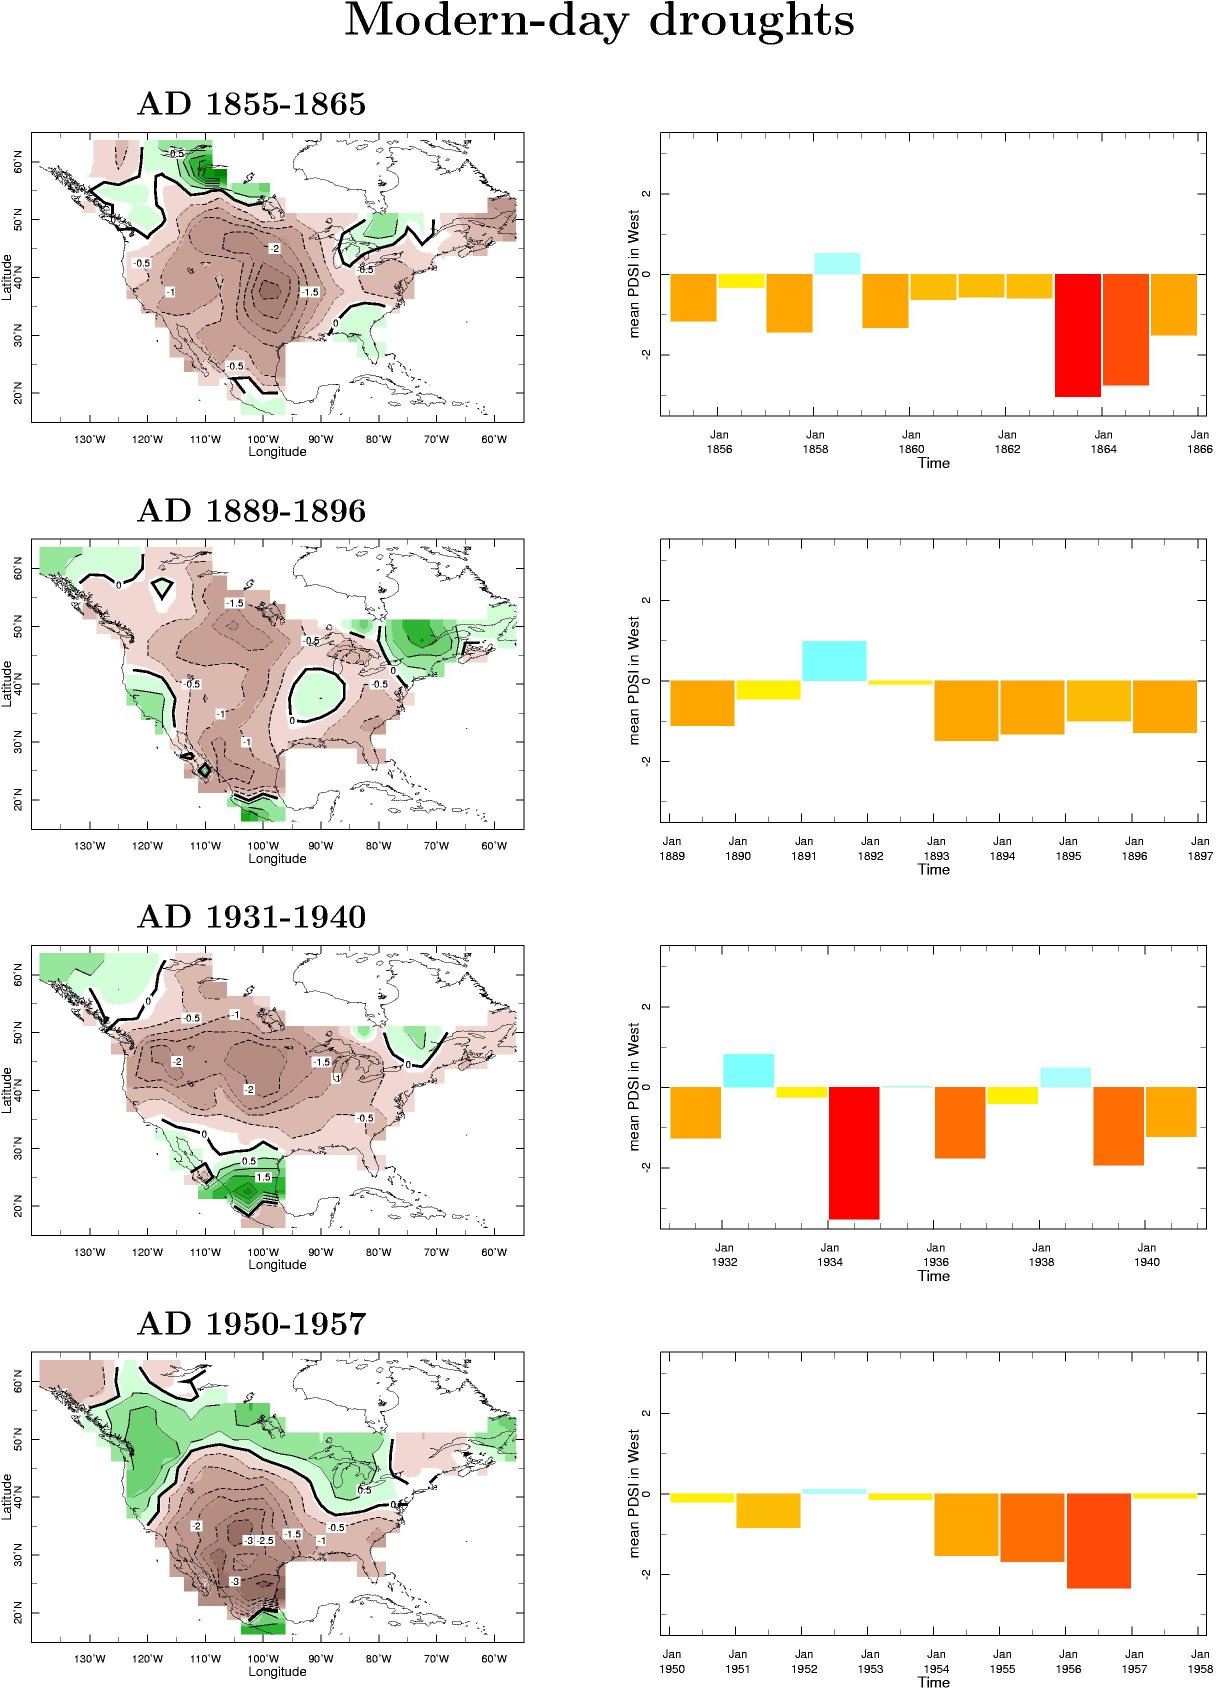
In the last year a collaboration between the Tree Ring Lab and the Climate Modeling and Diagnostics Group at LDEO has allowed a closer look at the tree ring records of drought. Figure 2 shows the summer PDSI reconstructed from the tree ring records for the modern day droughts as well as time series of the PDSI averaged over a region defined as the American West (25N to 50N and 125W to 95W) for the years covered by the droughts. By comparison to instrumental records, it is clear that the tree ring growths faithfully record the droughts. Each drought effected much of North America from the Appalachians to the Pacific coast and from the northern Mexico and the Gulf Coast into Canada. Each was also associated with weak tendencies to wetter conditions in the Pacific Northwest, maritime eastern Canada and southern Mexico. In the year by year evolution the multiyear droughts were made up of years of severe drought interrupted by more modest years and the occasional wet years. None appear monolithic in having dry conditions year after year after year although the Civil War drought comes closest to this.
Figure 2
Spatial patterns of tree ring records of drought and related ocean conditions
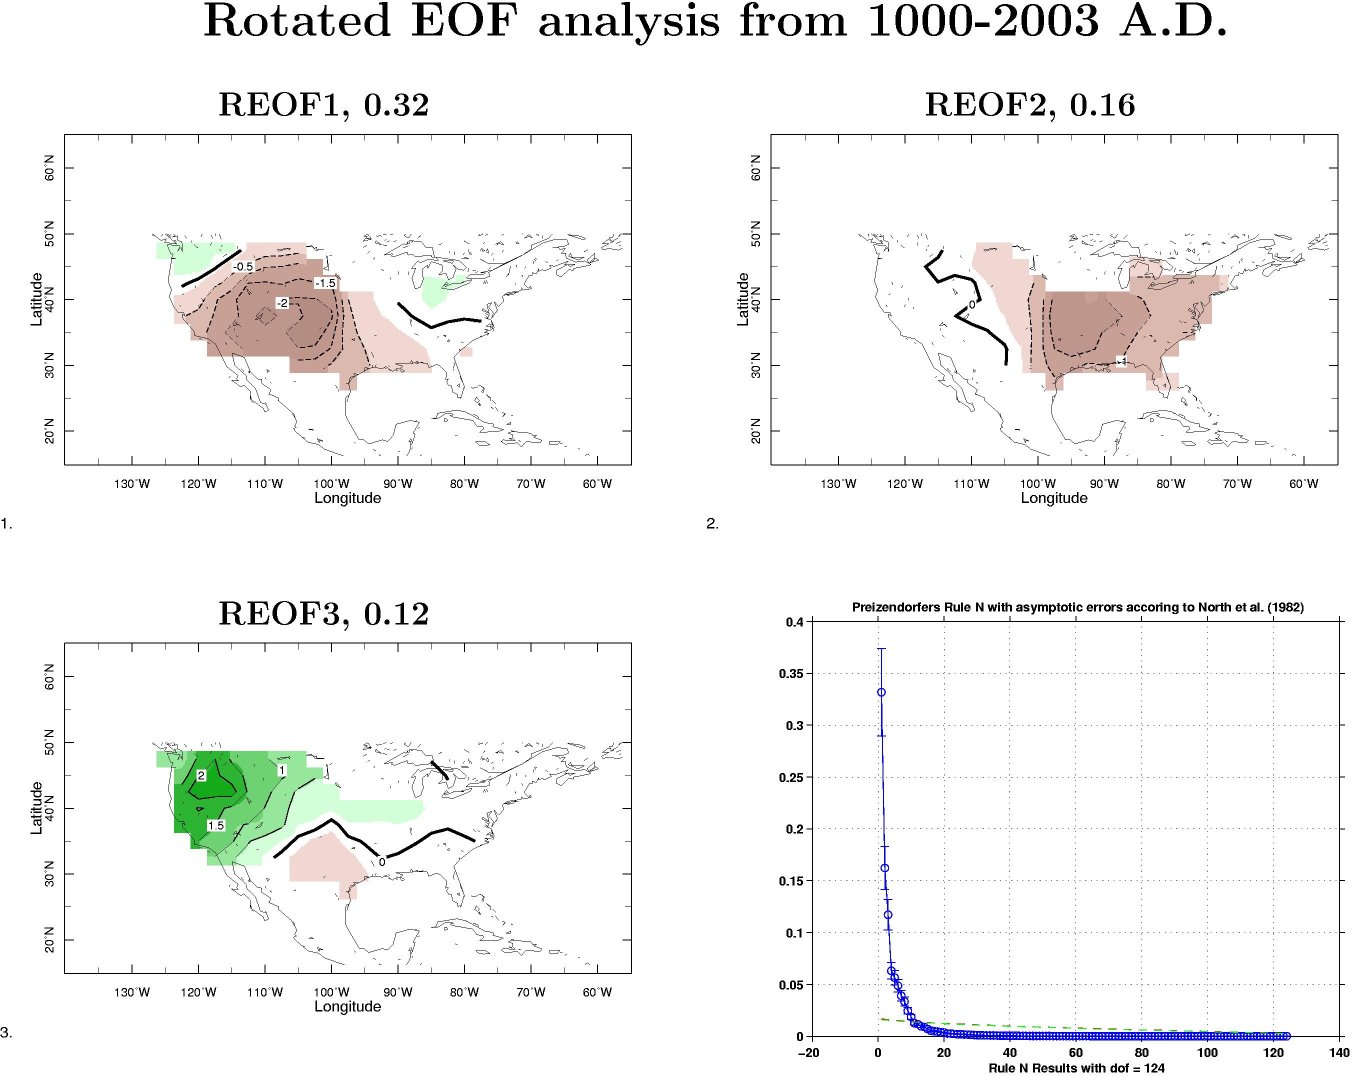
Figure 3 shows the results of an analysis, by Rotated Empirical Orthogonal Functions (REOF), of the spatial patterns of the tree ring records of droughts during the modern period. The first pattern, which explains 32% of the total variance, well describes the observed droughts in covering most of the United States with weak opposite-signed regions in the northwest and northeast. The second and third patterns would better describe droughts more localized in the east and west of the continent.
Figure 3
The patterns of sea surface temperature (SST) and sea level pressure (SLP) associated with these patterns can be reconstructed via linear regression onto the time series of the relevant REOF. This is shown in Figure 4. The first, dominant mode, is correlated with a La Niña-like SST and SLP pattern: cold in the tropical Pacific Ocean with warm anomalies in the mid-latitude Pacific, a cold Indian Ocean and a seesaw of SLP between the eastern and western hemispheres. The other two patterns do not seem to be linked into coherent and known patterns of ocean variability. The second pattern could, however, be related to the North Atlantic Oscillation.
Figure 4
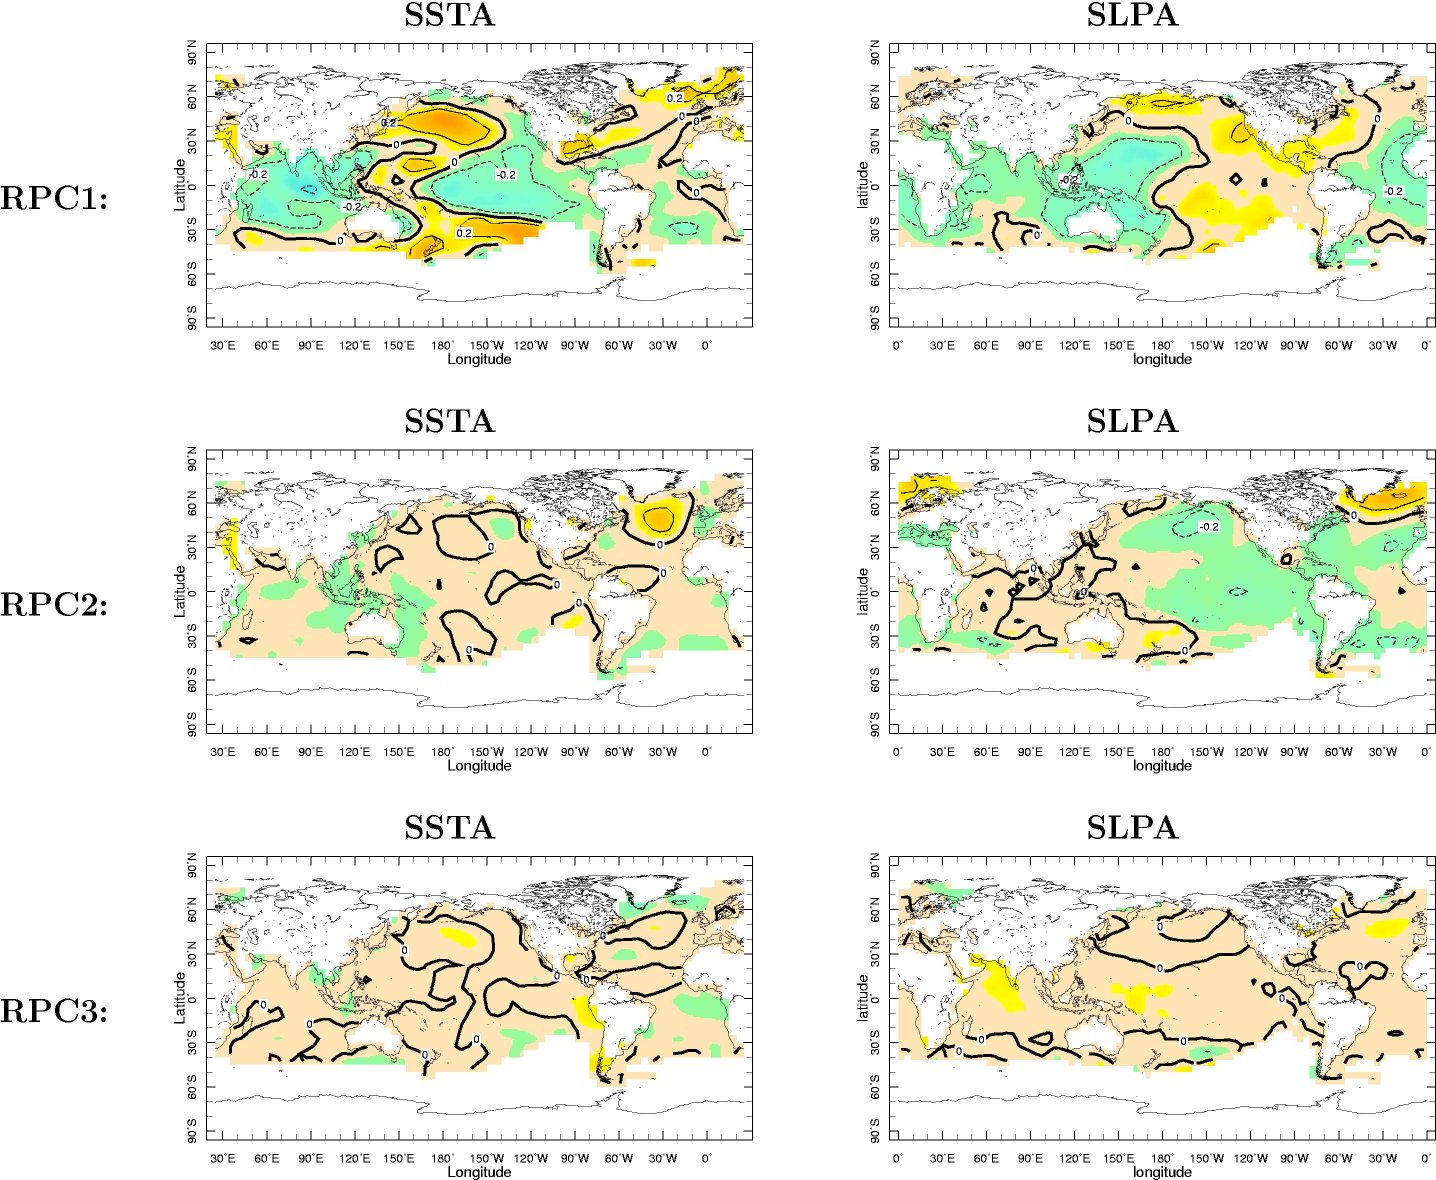
These results support our modeling work of the 1856 to current period in that tropical Pacific influence dominates but that there may be a secondary Atlantic influence too
Tree ring records of medieval droughts
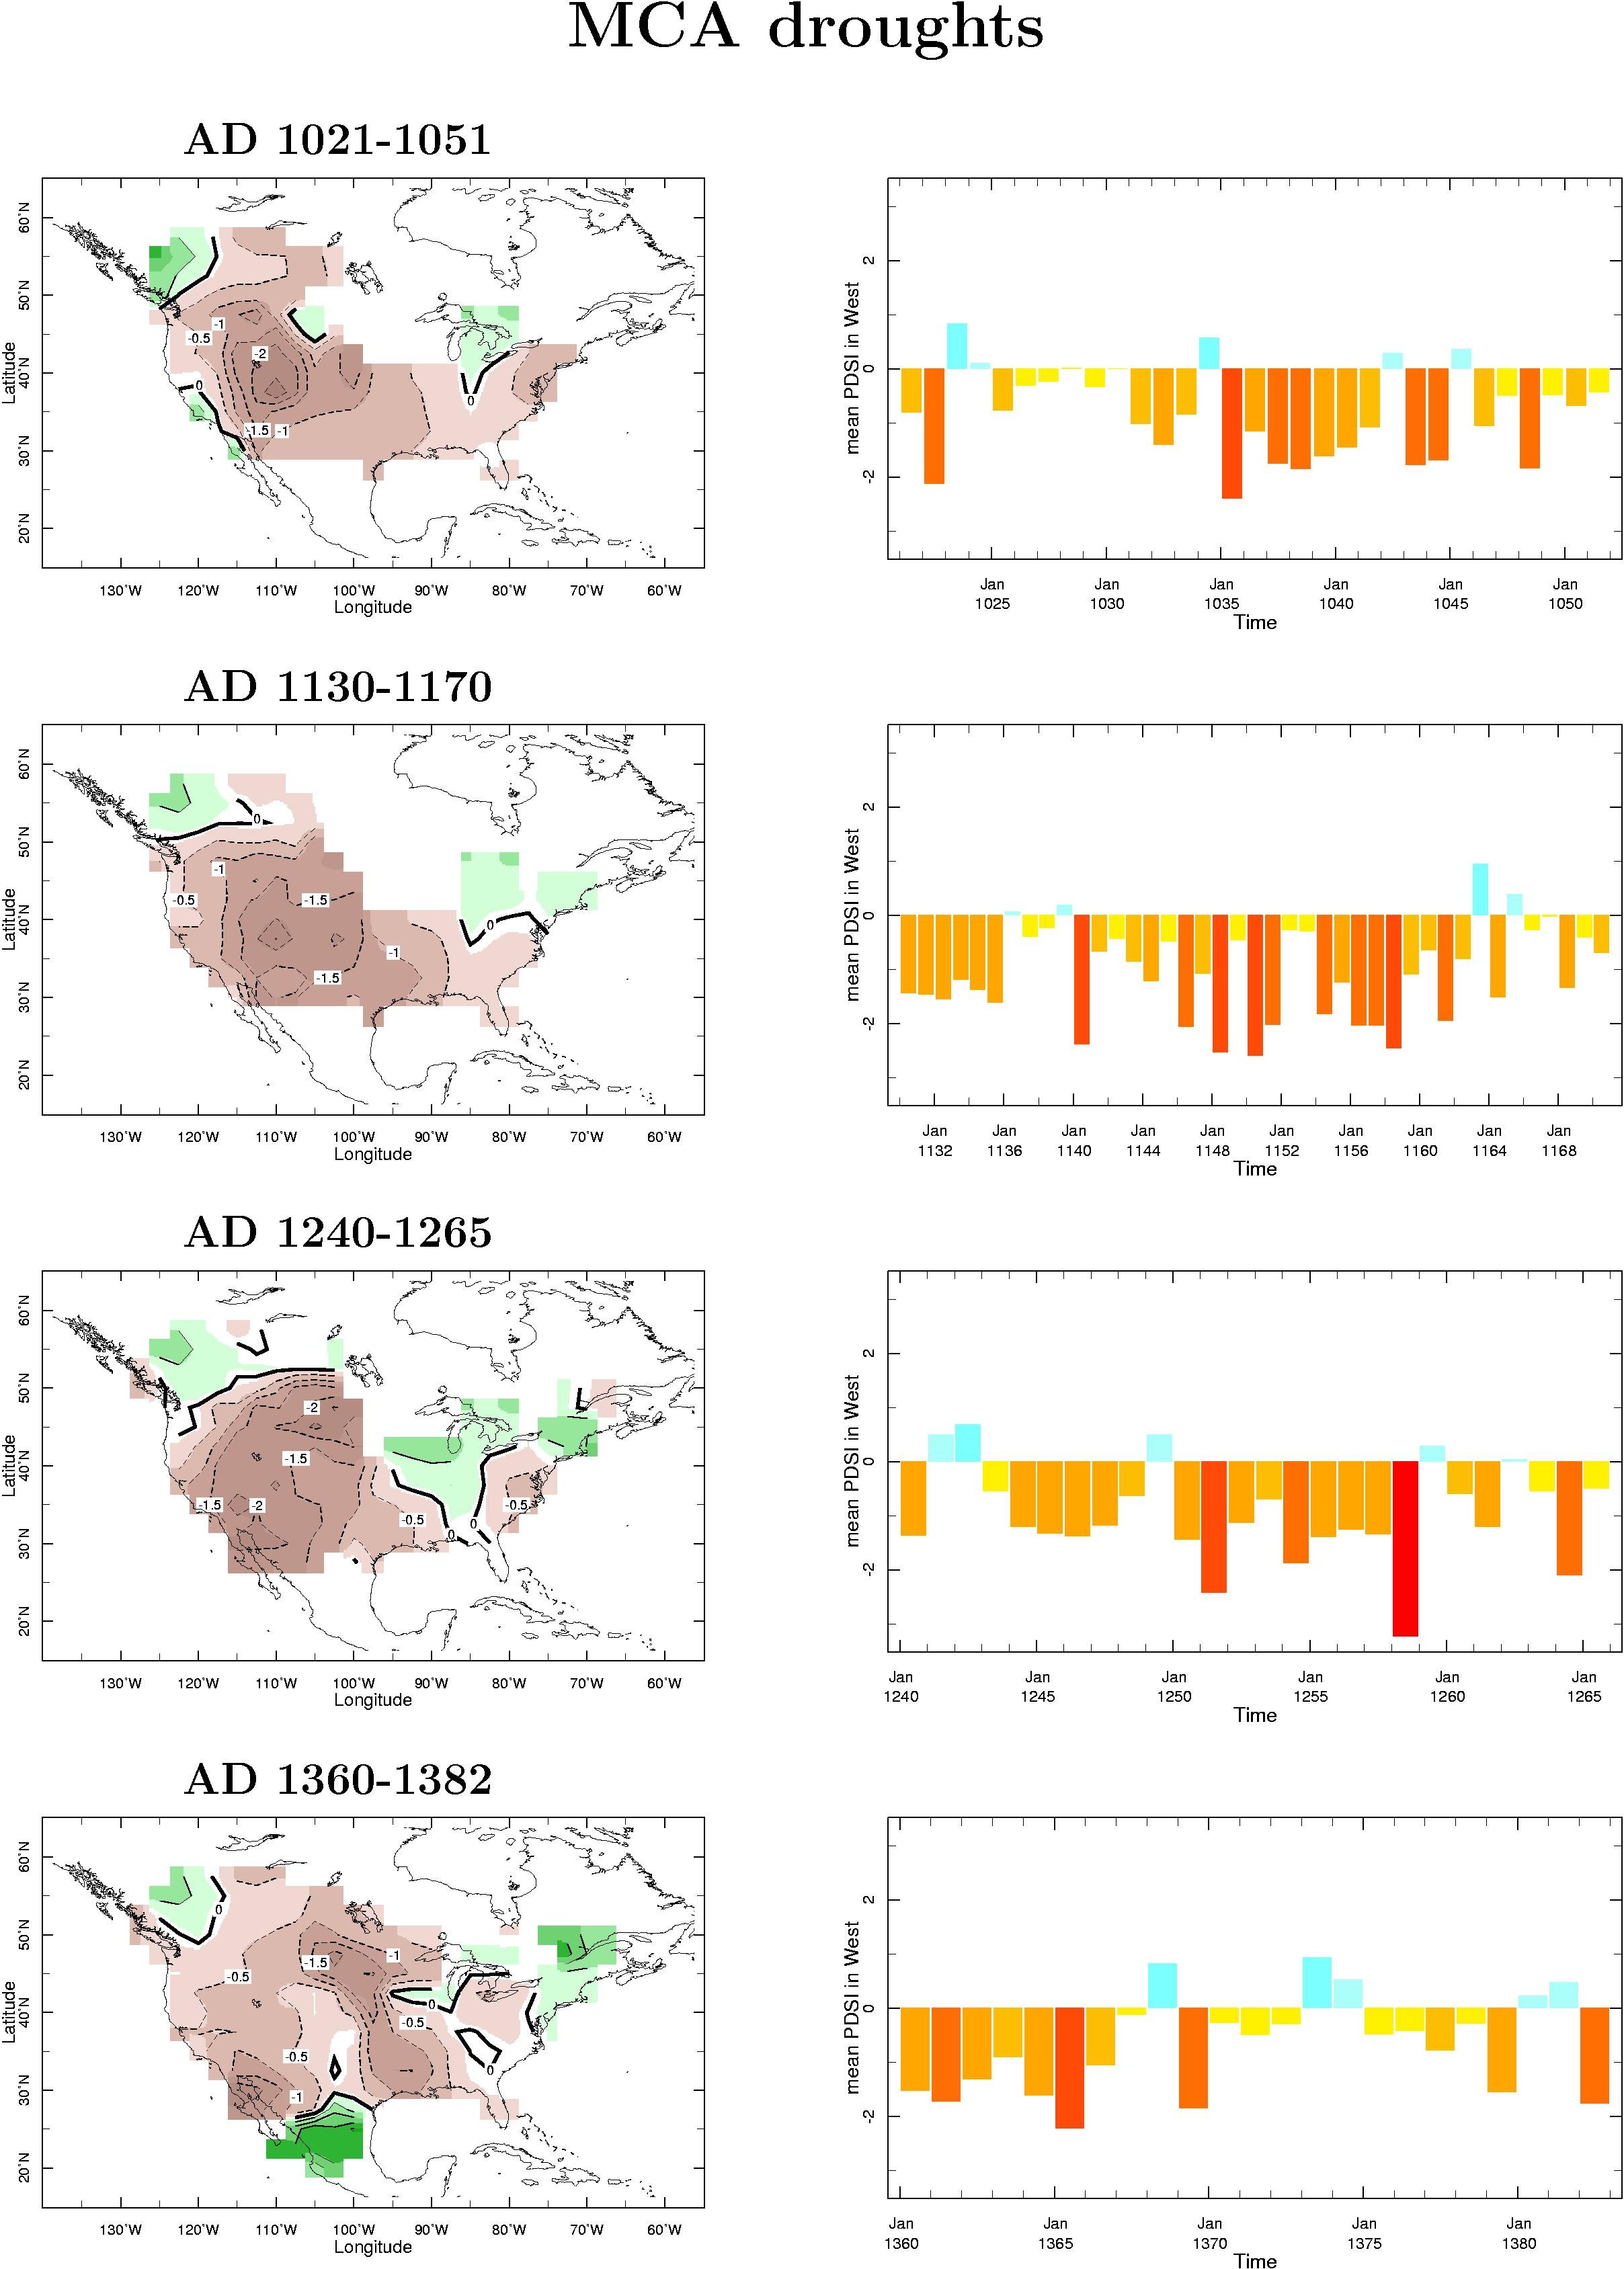
Figure 5 shows the spatial patterns and histories for a collection of medieval megadroughts. (Note that the time series in this figure extends over a much longer period of time than for the modern drought figure above.) Compared to the figures for the modern droughts what is remarkable is how similar the spatial pattern of the medieval droughts is to those with which we are familiar from experience and the instrumental record. The severity of drought in any year was also similar to that of a modern day drought. It is the year to year persistence of the medieval droughts that is different. Years as dry as 1936 or 1939 during the Dust Bowl drought frequently occurred year after year, and often with no break, (e.g. between 1140 and 1165) during medieval times.
Figure 5
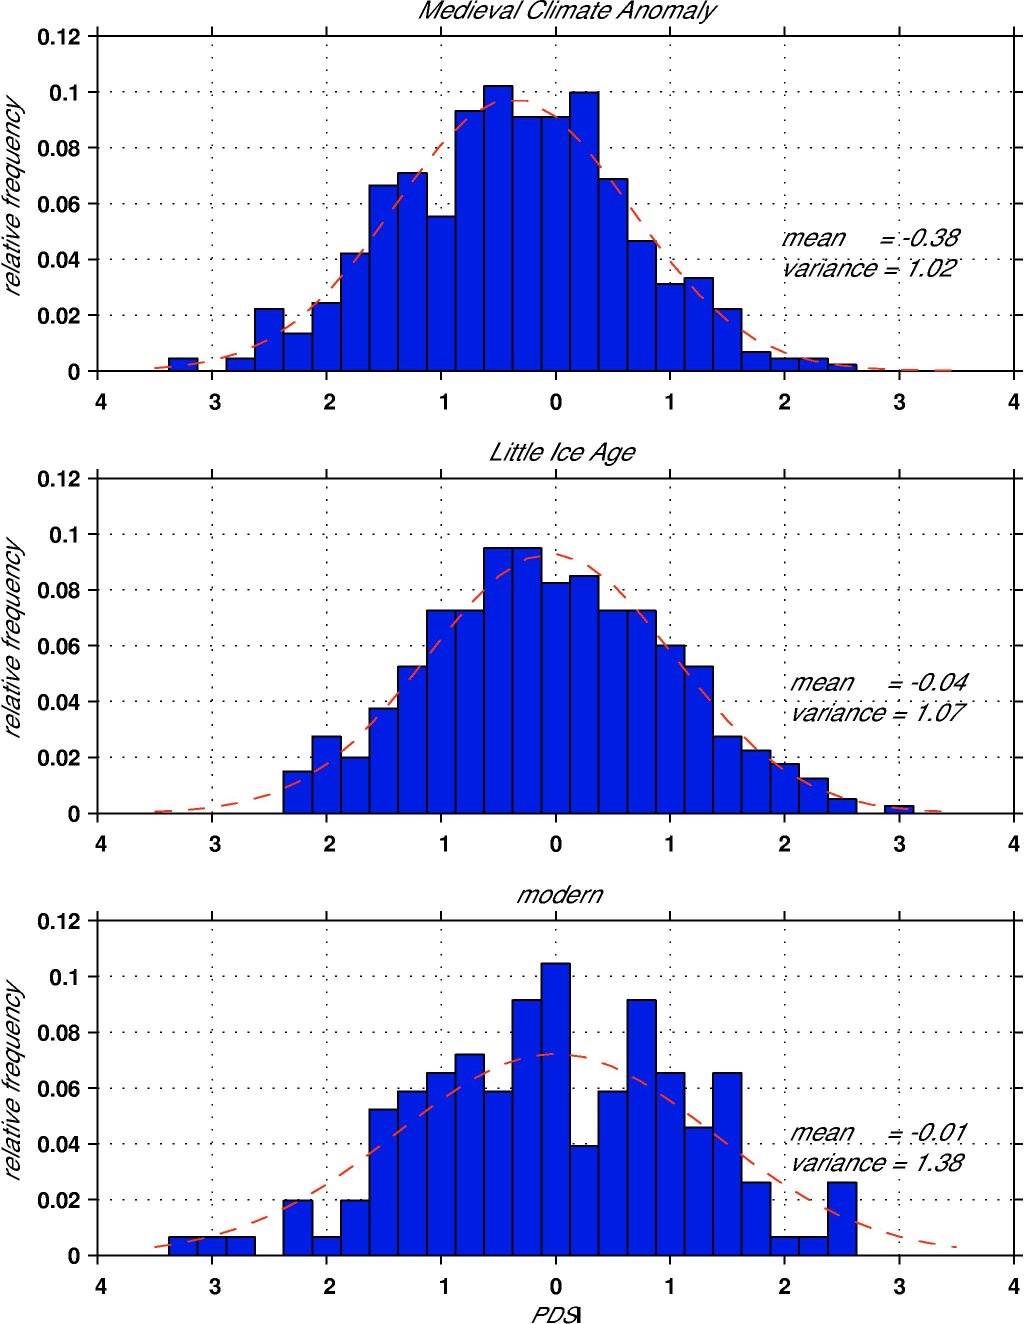
The year to year variability of drier and wetter conditions still occurred during the medieval period, albeit about a drier mean state. This is shown in Figure 6. Since ENSO currently influences such interannual variability this suggests that ENSO was operative then as now.
Figure 6
These results suggest three obvious conclusions:
The global pattern of medieval hydroclimate
If a cooler tropical Pacific Ocean was the cause of the medieval megadroughts then, analogous to the historical period, we would also expect the climate to have been drier in southern South America, wetter in northern South America and Central America, wetter in the Sahel region of Africa but drier in coastal east Africa and drier in parts of the Mediterranean and southern Europe. There should also be evidence of colder ocean temperatures in the tropical Pacific. Figure 7 shows a compilation of proxy evidence (from trees, lake records, Nile flow records, ocean sediments etc.) for hydroclimate conditions during the medieval period. Broadly speaking, the evidence of wet and dry conditions fits into the global pattern of hydroclimate change established for the historical period using satellite data, instrumental records and climate models. One of the more intriguing records comes from records of Nile flow. This tends to be low during El Niño events as rainfall is reduced over the headwaters of the White Nile. Therefore La Niña conditions tend to support high Nile flow. In a 1993 paper analyzing the Nile records Quinn shows that low flows were only half as common during the medieval period as they were during the subsequent Little Ice Age!
Figure 7
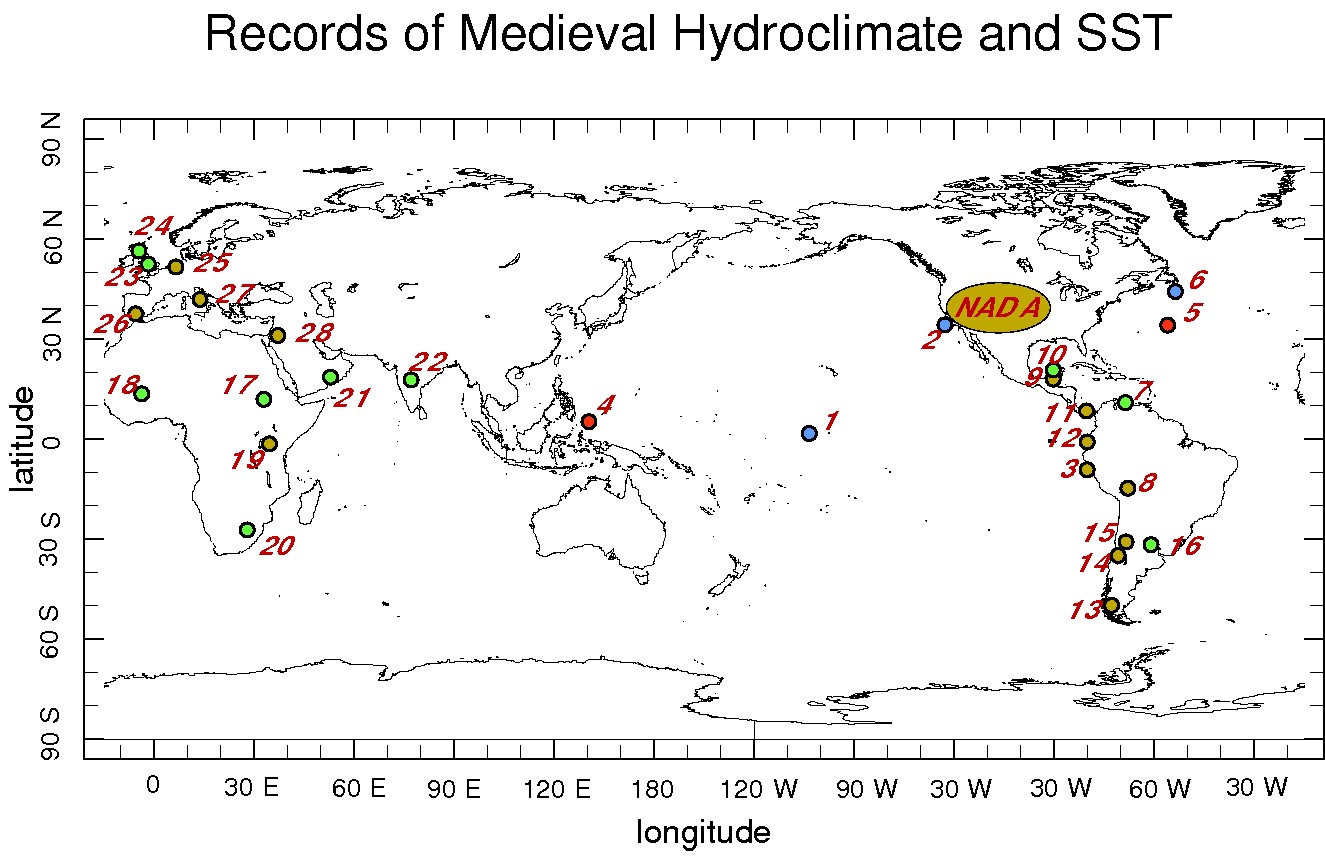
For the tropical Pacific Ocean itself there is only one published record of reconstructed ocean temperatures - based on the geochemistry of corals found on the island of Palmyra and analyzed by Kim Cobb, see web page. She interprets her data to indicate a colder tropical Pacific ocean during the periods of the medieval epoch for which she has data. Consequently, despite considerable limitations of the proxy evidence, to date it does support the idea that, during medieval times, the global hydroclimate tended towards what we would now call a La Niña-like state. A first attempt to use the coral data to try to model the megadroughts can be found here.
Publications:
The following research papers can be downloaded:
For further reading:
|
|
||||||||||
LDEO home | search | ocp webmaster
Copyright © 2011 by The Trustees of Columbia University in the City of New York, Lamont-Doherty Earth Observatory.
All rights reserved.