
|
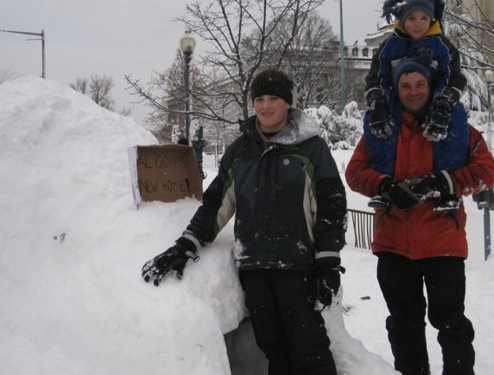
| During one storm, Senator Inhofe's family built an igloo that they named 'Al Gores' new home'. |
In a just published paper in Geophysical Research Letters (PDF) we attempt to offer an explanation of the northern hemisphere snow anomalies of winter 2009/10. The simple answer is a combination of an El Niño event and a strongly and persistently negative North Atlantic Oscillation. El Niños are warmings of the tropical Pacific Ocean that occur every few years as a result of natural atmosphere-ocean interaction in the tropical Pacific region and are predictable up to a few seasons in advance. The North Atlantic Oscillation (NAO) is a seesaw of atmospheric pressure above the North Atlantic Ocean between the Icelandic Low and the Azores high and arises from purely atmospheric dynamics and is not predictable beyond the week or two timescale of weather forecasting.

|
It turns out that the snow data was a bit of a mess - there was no long and continuous data sets of snowfall updated to the current month. Instead we used two data sets: one was for snowfall at weather stations in the US and went from 1950 to 1999 and the other was hemispheric, satellite-derived snow water equivalent (SWE) from 1979 to 2007. We took the December through March values of these and correlated and regressed them with the Nino3 index of tropical Pacific sea surface temperatures (SSTs, the Nino3 index is SST anomaly averaged 5S-5N, 150W-90W) and the NAO and with a new NINO-NAO index (the normalized NINO3 SST index minus the normalized NAO index). Figure 1 (link) shows the relations for U.S. snowfall and Figure 2 for hemispheric SWE.
For U.S. snowfall an El Niño is associated with generally high snowfall in the southern Rockies, in the southeast and along the east coast and less snowfall to the north of these regions. A negative NAO has stronger correlations with snowfall and brings increased snowfall to the mid-Atlantic states. The correlation with an El Niño and a negative NAO (i.e. with the NINO-NAO index) shows a north-south dipole with snowier conditions to the south and less snowy to the north. The relations with satellite-derived SWE (see Figure 2) are consistent with snowfall over North America and also show that a negative NAO brings increased snow to northwest Europe.
We then examined the causes of the snow anomalies. They could arise from change in total precipitation or from a change in the proportion falling as snow instead of rain. We know from prior work that El Niño brings more precipitation to the southern U.S. (coast to coast) and less to the Pacific Northwest so the increased snow in the southwest and less in the Pacific Northwest is partly explained by this. A negative NAO has little correlation to total precipitation amount over the U.S. and actually causes reduced precipitation over northwest Europe. However a negative NAO also brings cold to the North Atlantic sector from eastern North America into Europe. Hence, in these regions, we expect more of the total precipitation to fall as snow. Figure 3 (link) shows the relation of lower atmospheric temperature to the NINO3, NAO and NINO-NAO indices and the cold over the southern U.S. and Europe are very clear (with warm in the subolar regions). Figure 3 also shows a measure of the location of storm tracks (the upper tropospheric variance of meridional velocity) and demonstrates that both El Niño and a negative NAO cause the northern hemisphere winter storm track to shift south which enables snowstorms to strike across the southern and central U.S.
In winter 2009/10 the Nino3 SST anomaly averaged about 1°C, a decent sized El Niño. The NAO index for December 2009 through February 2010 was a whopping -2.38 standard deviations (making this a highly unusual event). Using these values we can calculate the NINO-NAO index value for 2009/10 and then use the relations in Figures 1 and 2 to compute expected snowfall and SWE for the winter. These are shown in Figure 4 (link). As stated above, we do not have continuous snow data sets that both cover past decades that are also updated to current. Instead, to verify our expected snow anomalies against, we show the snowfall anomaly from a recent data set (the 2009/10 values minus the average of the three previous winters) and satellite-derived snow cover anomalies (which, note, are zero in regions that are always snow covered in winter). The expected values match the observed snow anomalies quite well confirming that the snow anomalies of the past winter were caused by the combination of an El Niño event with the negative NAO.
Of the two climate phenomena, the NAO is the dominating influence in the eastern U.S. and northwest Europe and, since it cannot be predicted beyond the timescale of weather forecasting, this means that snowy winters like this past one will remain a seasonal surprise. In summary, what happened this past winter is just another example of the kind of seasonal climate anomaly that can arise from purely natural variability of the atmosphere-ocean system. There seems no evidence that it had anything to do with climate change and should not be exploited to make arguments, one way or another, about the reality of that (which we do not doubt) or how to tackle it.
The work was carried out by Richard Seager, Yochanan Kushnir, Jennifer Nakamura, Mingfang Ting and Naomi Naik, all of the Lamont Doherty Earth Observatory, Earth Institute, Columbia University.
A research team at NOAA have come to similar conclusions using different analyses. See http://www.climatewatch.noaa.gov/2010/articles/forensic-meteorology-solves-the-mystery-of-record-snows.
|
Figure 2.
Same as Figure 1 but for snow water equivalent. Units for the regression are mm.
|

|