 |
|
LAMONT-DOHERTY EARTH OBSERVATORY THE EARTH INSTITUTE AT COLUMBIA UNIVERSITY |
|
| Drought Research | |

|
Mexican drought: natural variability and climate change from the Medieval period to the greenhouse future
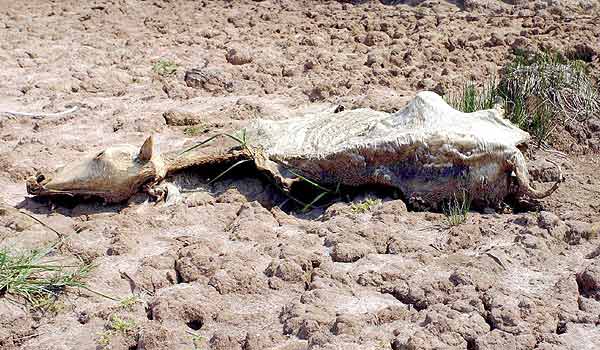
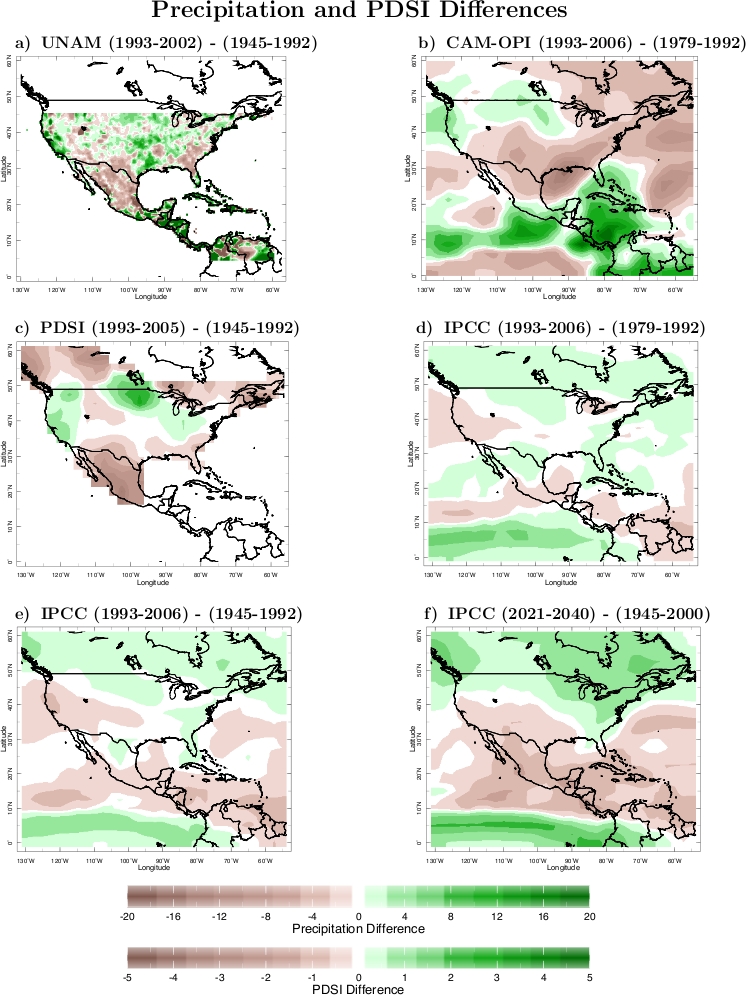
The ongoing drought in the western U.S. began in 1998 and has now continued, with some interruptions and despite a quite wet winter 2007/8, for close to 10 years. Less well know is that this same drought has impacted Northern Mexico and even began earlier there. The Mexican drought has coincided with major changes in the Mexican economy and agriculture triggered by the North American Free Trade Agreement and moves to privatize water supply in much of Mexico. The combination of drought and economic change has created serious social impacts in Mexico with impacts on internal and cross-border migration. Both the southwestern United States and Mexico are robustly projected by climate models to dry in the current century intensifying social impacts in Mexico where water resources are already stretched. As such it is important to understand the causes of droughts in Mexico, assess their predictability, examine modern droughts in the context of climate change over the last several centuries and examine the character of projected anthropogenic induced drying as a means to assessing whether it is yet occurring. This is what we try to do in a recent Atmosfera paper (PDF).
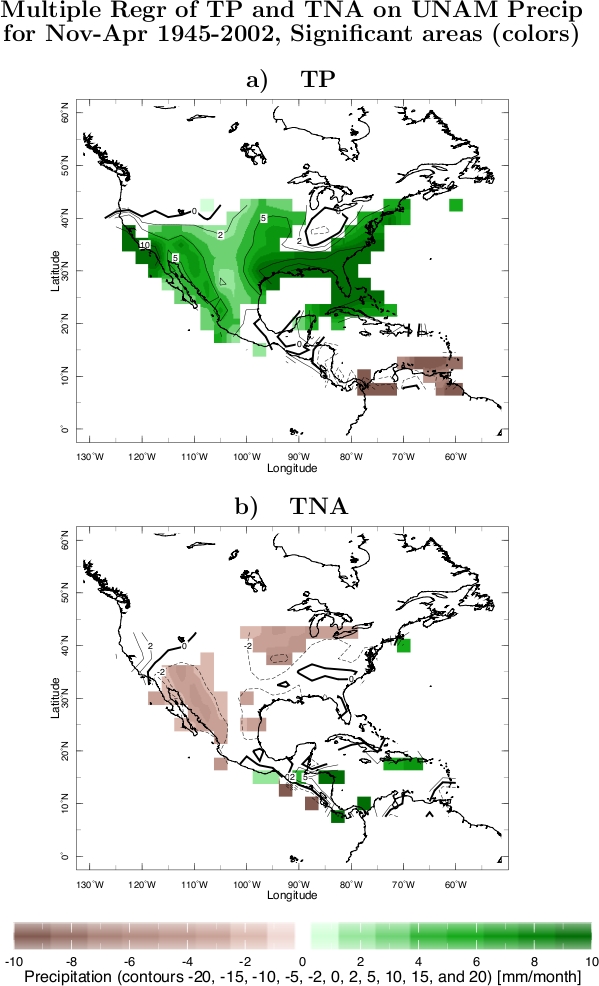
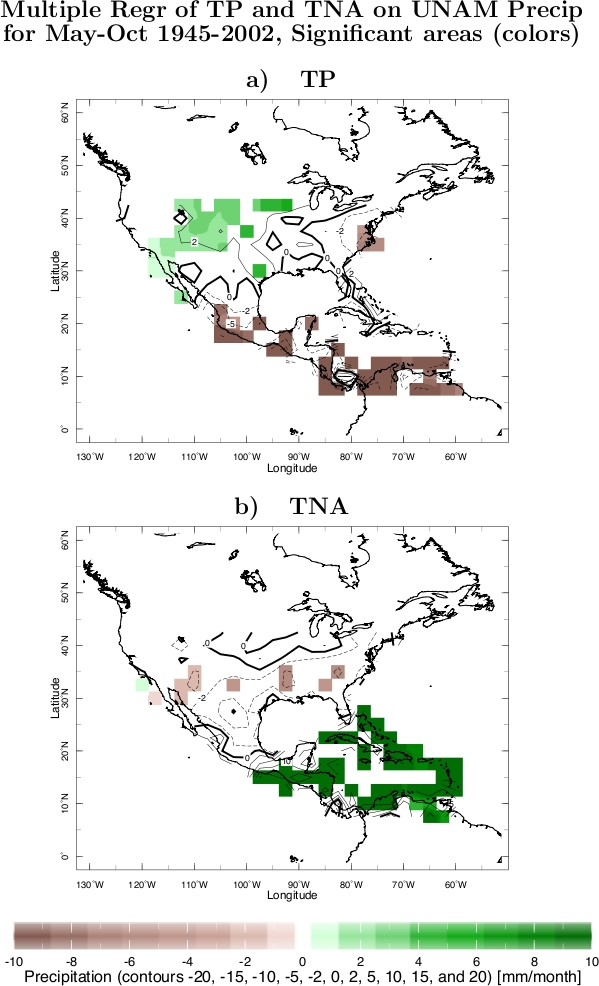
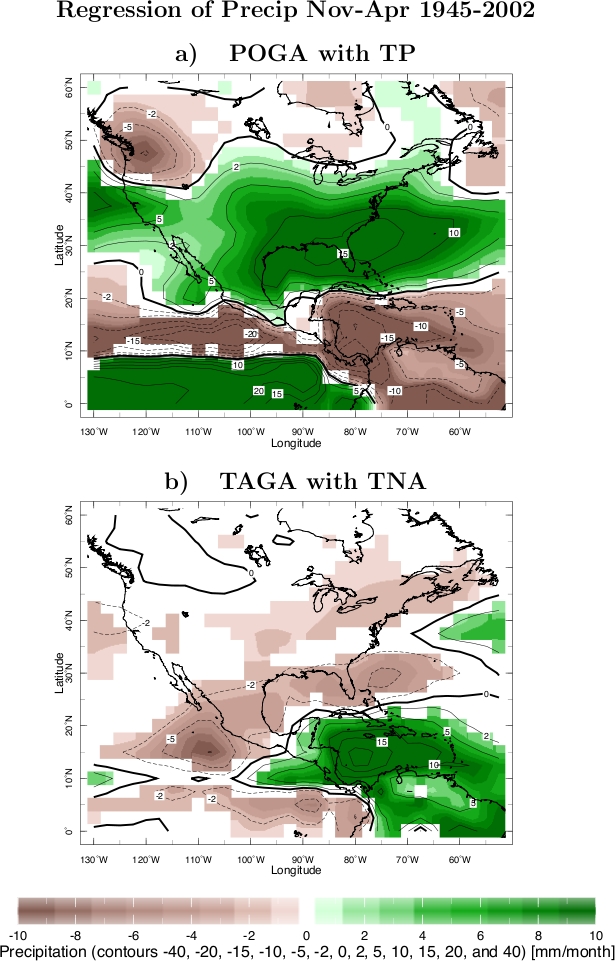
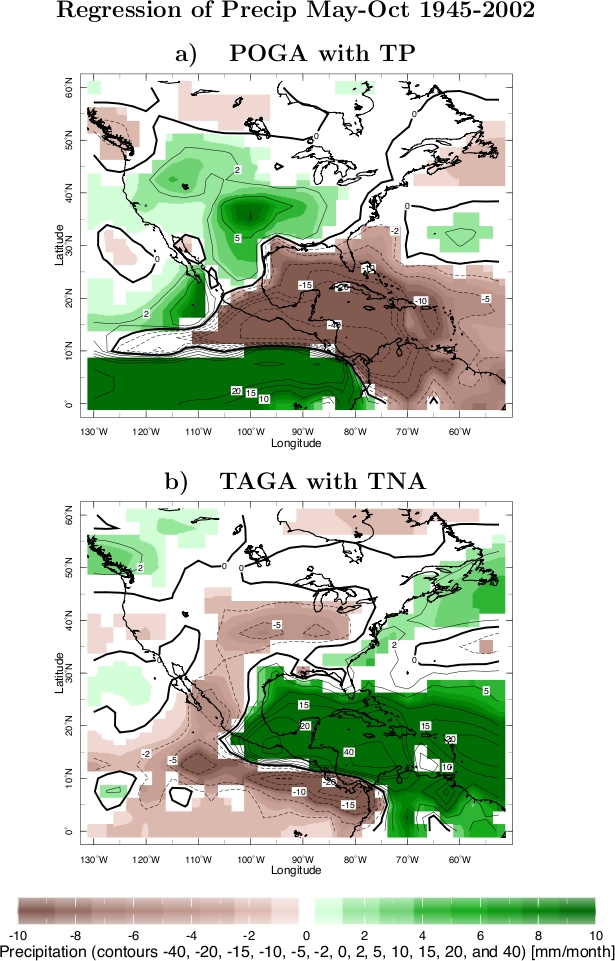
In the paper we use instrumental observations to show that Mexican hydroclimate is impacted by both tropical Pacific and tropical Atlantic SST anomalies. During winter half years El Niño events in the Pacific tend to make all of Mexico wetter than normal. El Niño conditions during the summer half year tend to make northern Mexico wet but southern Mexico dry. Warm tropical Atlantic SSTs tend to make northern Mexico dry (mostly in the winter half year) and southern Mexico wet (mostly in the summer half year). These SST-Mexican hydroclimate relations are reasonably well produced in an atmosphere model forced by historical observed SSTs indicating potential predictability (if SSTs can be predicted).
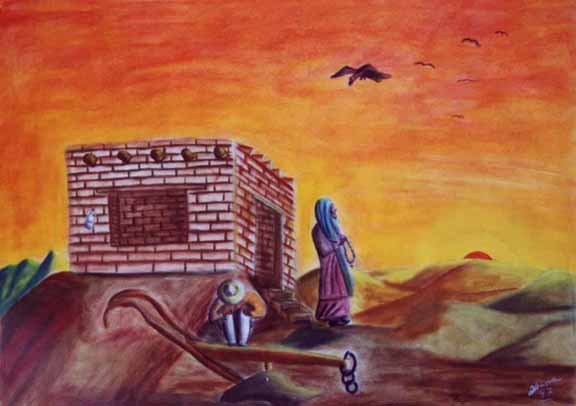
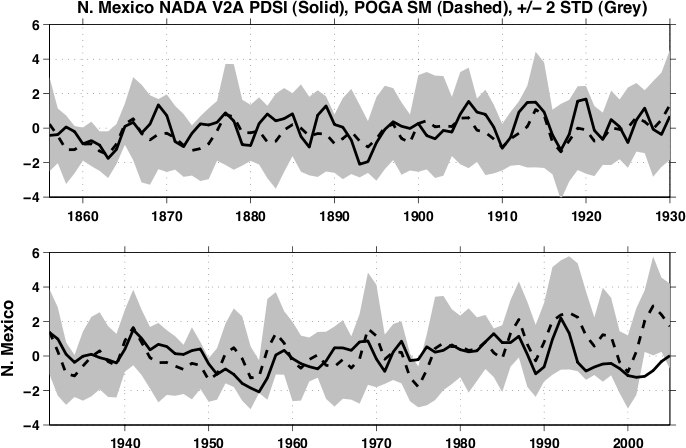
Instrumental records of precipitation are sparse over Mexico before the mid 20th Century so we also looked at tree ring records that reconstruct spring-summer Palmer Drought Severity Index. Model simulations of the entire period of ship-based SST observations - 1856 to now - were verified against the tree records. The early to mid 1890s and the 1950s droughts stand out as severe within the last century and a half. The 1890s persistent drought - which caused starvation across northern Mexico - seems to have been forced by a persistent La Niña while the 1950s drought was potentially influenced by both the Pacific and the Atlantic Oceans.
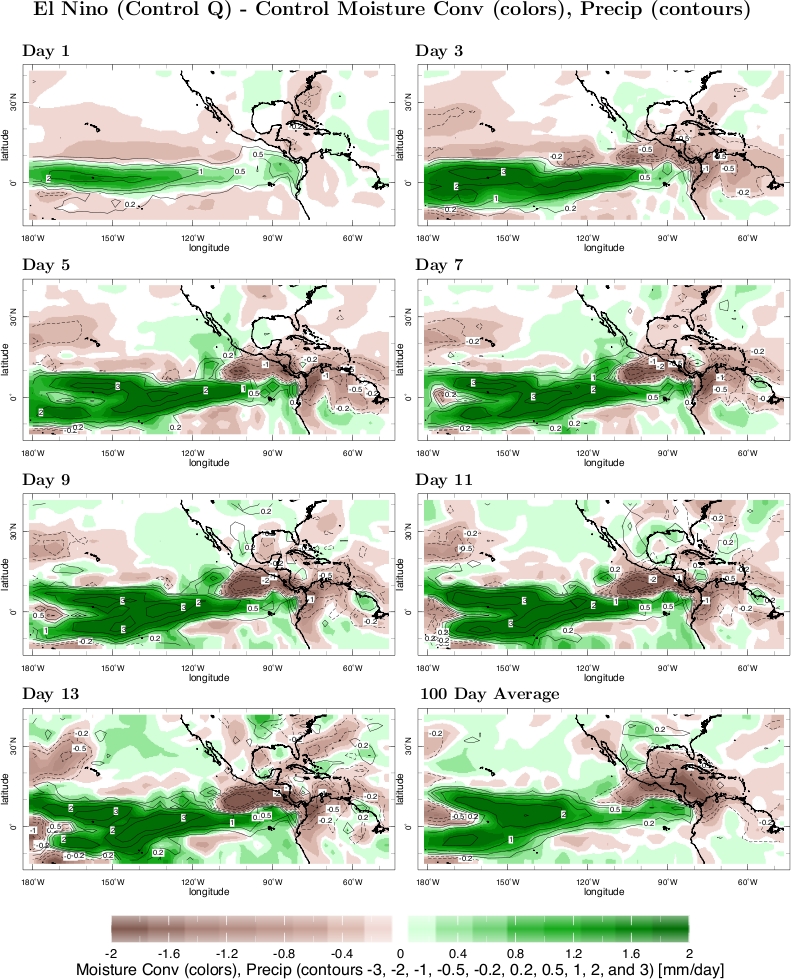
A novel modeling method is used to examine the means whereby the tropical Pacific influences Caribbean and Mexican precipitation during the summer season. We use a 100 member ensemble of 100 day integrations and examine the day by day evolution of the atmospheric response to a sudden turn-on of a tropical Pacific SST anomaly. Kelvin waves force vertical motion and precipitation anomalies to the east of the Pacific. The induced atmospheric heating anomalies over the tropical Atlantic excite Rossby waves that transmit a signal to the north and west creating the summer time precipitation signal over Mexico, the Gulf of Mexico and the southern United States.
Analysis of tree ring records going back to the 14th Century does not show any multicentennial trends but does reveal a late 16th Century drought that far exceeded in severity any since. However model projections do show a robust drying of Mexico in the the early part of the current century. It is not clear that this anthropogenic drying is already underway since the current drought has a different spatial pattern. Anthropogenic drying is expected to impact all of Mexico whereas naturally occurring droughts have ended to strike either northern or southern Mexico but not all. 'All Mexico' droughts will place a new kind of strain on the country. The current drought has already had a notable impact on societies in northern Mexico and future drying will certainly have important consequences on agriculture and water supply for cites and industries and is likely to be part of a mix of factors that will impact future development, the economic and social well being of the Mexican people and internal and cross border migration.
|
|
|||||||||||
LDEO home | search | ocp webmaster
Copyright © 2011 by The Trustees of Columbia University in the City of New York, Lamont-Doherty Earth Observatory.
All rights reserved.
