Just out in Journal of Climate:
-
Seager, R., A. Tzanova and J. Nakamura, 2009: Drought in the Southeastern United States:
Causes, variability over the last millennium and the potential for future hydroclimate
change, Journal of Climate, 22, 5021-5045.
PDF
|
Drought in the southeastern United States: the recent drought in the context of a millennium of climate variability, physical causes and future hydroclimate change
| |
|
|
|
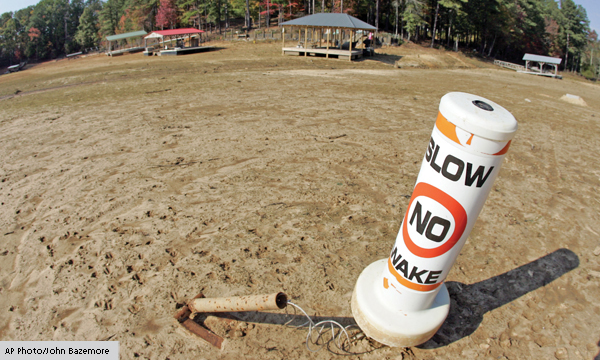
| Prolonged drought at Lake Allatoona in Acworth, Georgia. November 2007 photo from Manuel(2008).
|
From winter 2005/6 into winter 2007 - and by most measures still persisting as we enter summer 2008 - the southeastern United States, including Georgia, Alabama, Tennessee and Florida experienced a severe drought (Figure 1). The drought was causing the most trouble in the summer and fall of 2007 before winter 2007/8 brought some respite in heavy rains. The drought led to restrictions on water use, caused reservoir levels to drop dangerously, damaged crops and opened up conflicts inside and between states on access and use of declining water resources (see
Manuel (2008)).
|
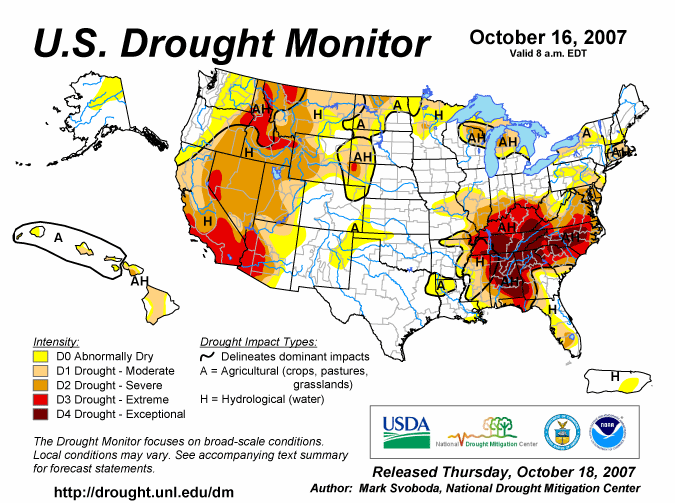
| The US drought monitor from October 16, 2007 at
the height of the recent Southeast drought. Much of the
Southeast was characterized as in extreme or
exceptional drought. |
The questions that the southeast drought brought up were was this drought exceptional? and was it caused by anthropogenic climate change? We have examined these questions - as well as looking into the causes of droughts in the southeast - in a recent paper in the Journal of Climate, see references. The work uses analyses of instrumental data, model simulations of the 1856 to 2007 period, analyses of millennium long tree ring records and model projections of future climate change (the IPCC AR4 SResA1B so called 'middle of the road' scenario for emissions).
The principle conclusions are:
-
The post 2005 drought was no more severe than earlier droughts, including the 1998 to 2002 drought (Figure 2). The intense water resource problems it caused are therefore probably more due to rising demand driven by rising population in the southeast than due to truly unusual weather.
-
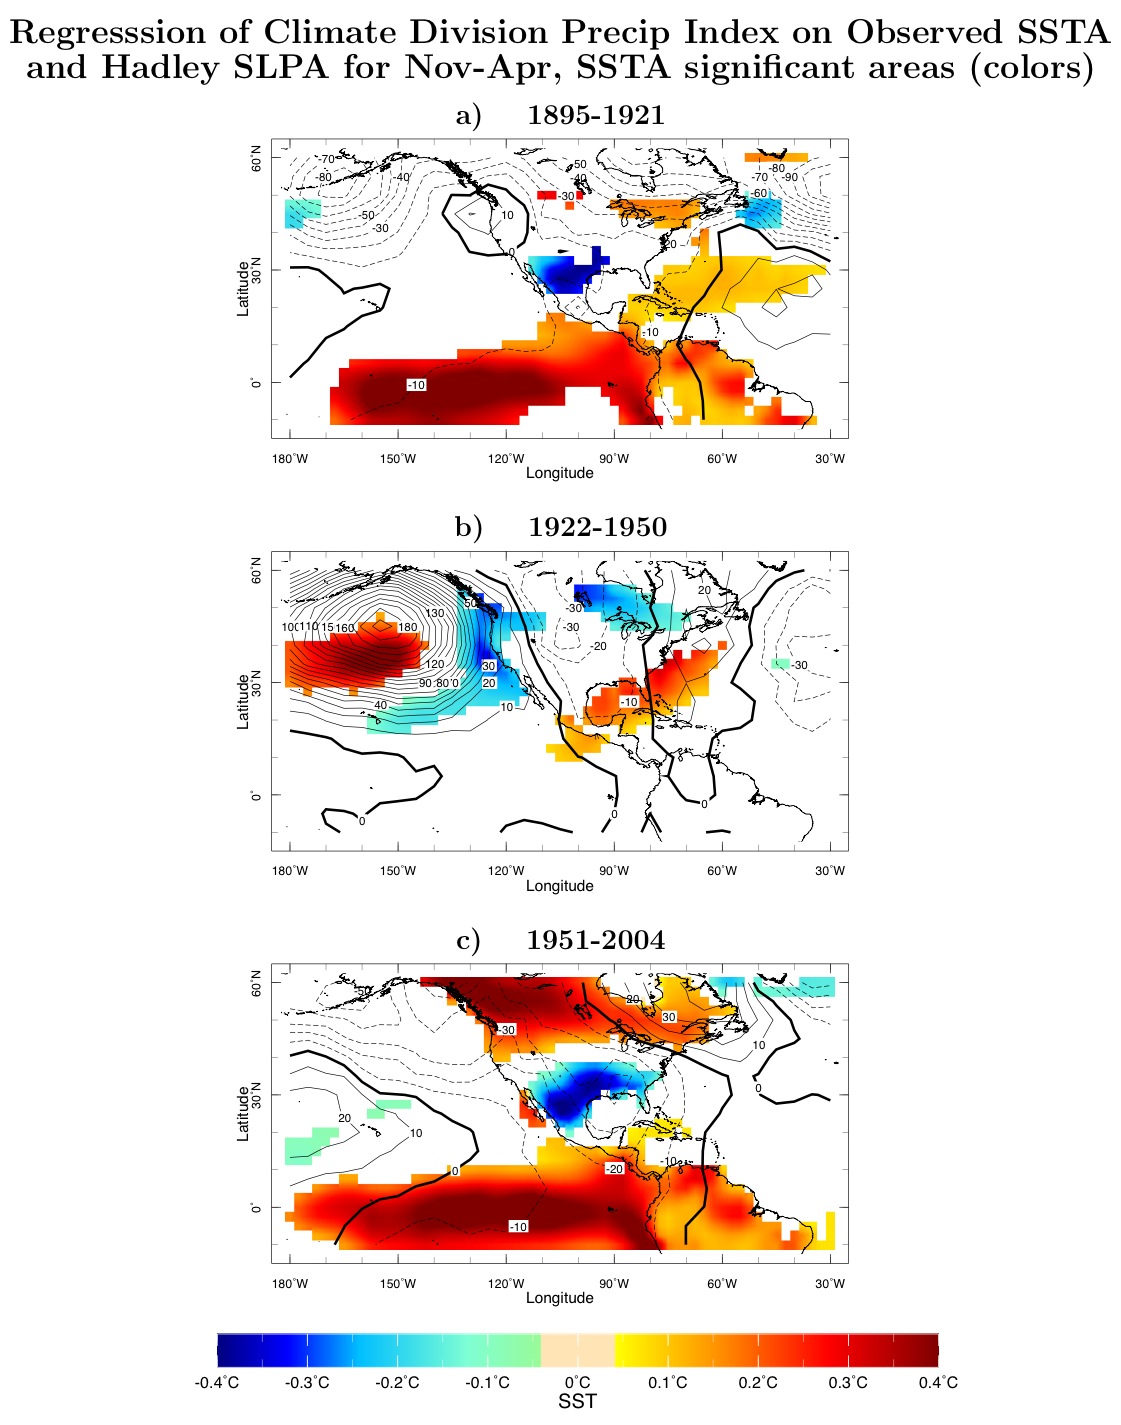
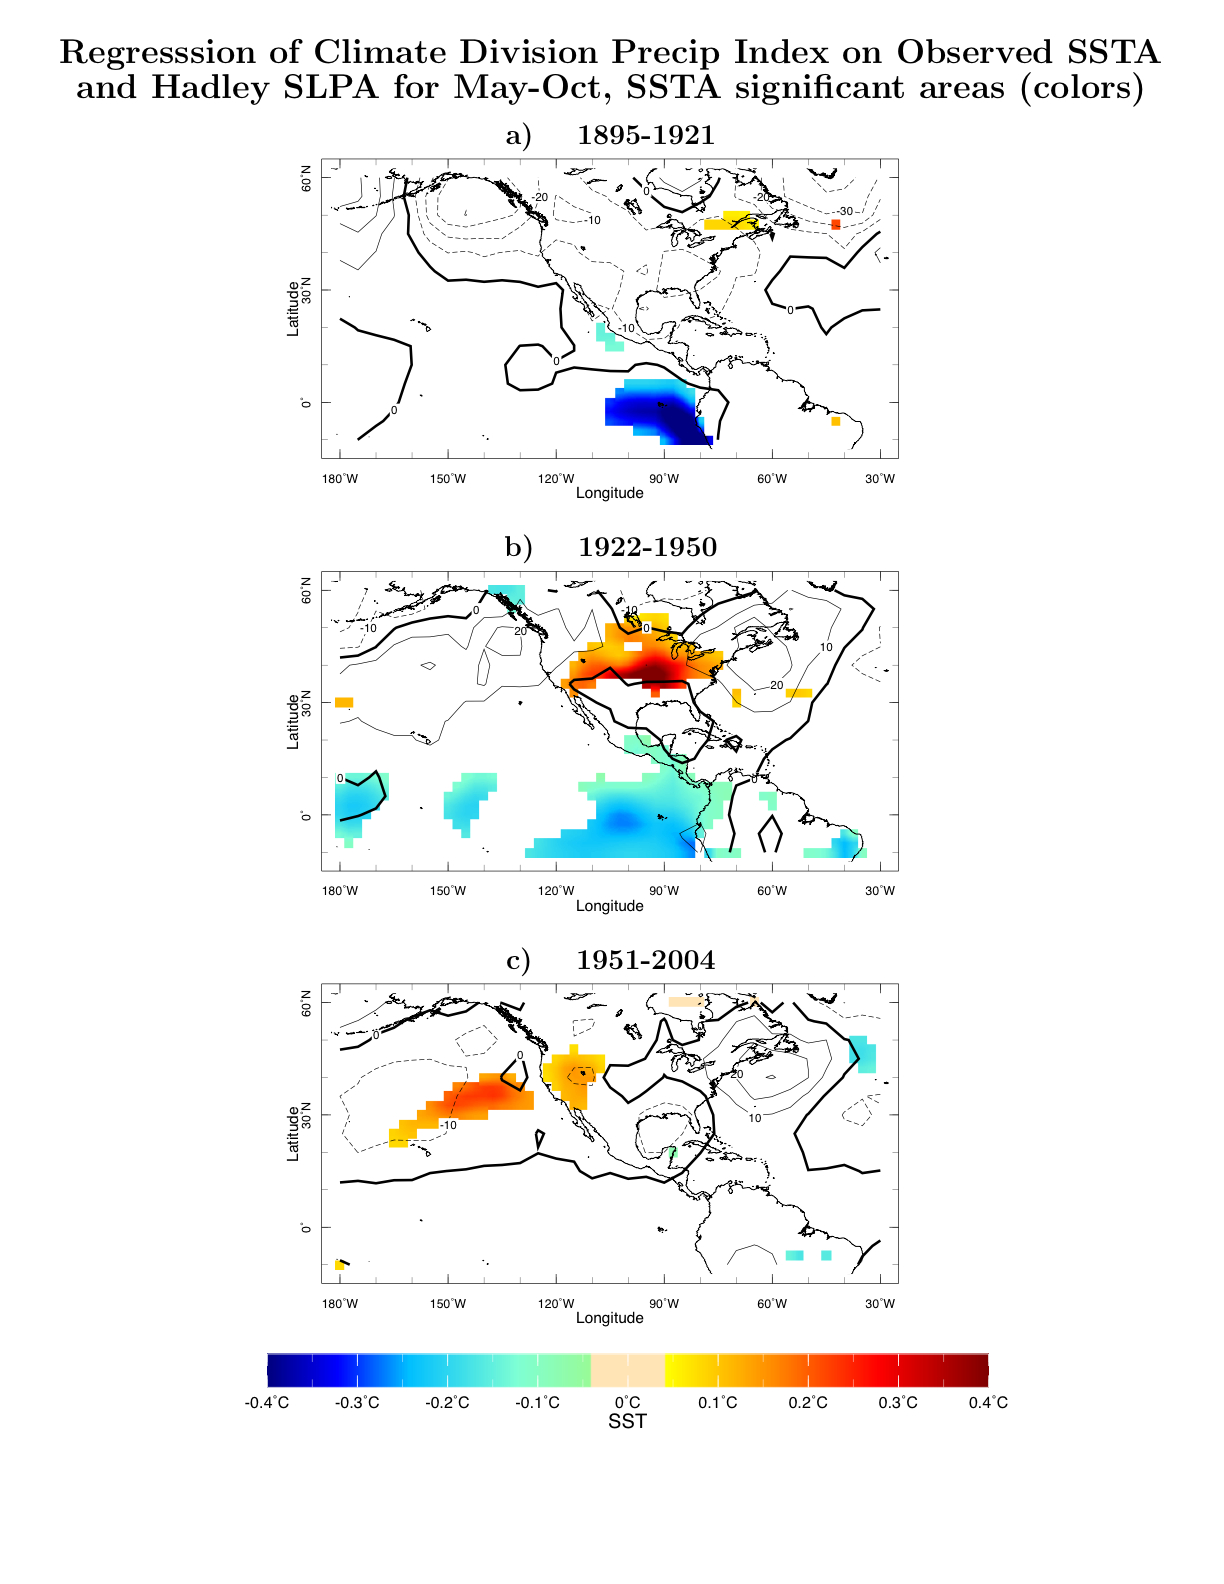
Dry winters in the southeast are weakly linked to La Niña conditions in the tropical Pacific Ocean (Figure 3). However this relationship has varied over time and appears to have been nonexistent - or of opposite sign - from 1922 to 1950 (which is why observed patterns are shown for three time intervals)Dry summers seem to be caused by internal atmosphere variability rather than coherent large scale atmosphere-ocean interaction (Figure 4). There seems little evidence that Atlantic sea surface temperature (SST) anomalies impact precipitation in the southeast.
-
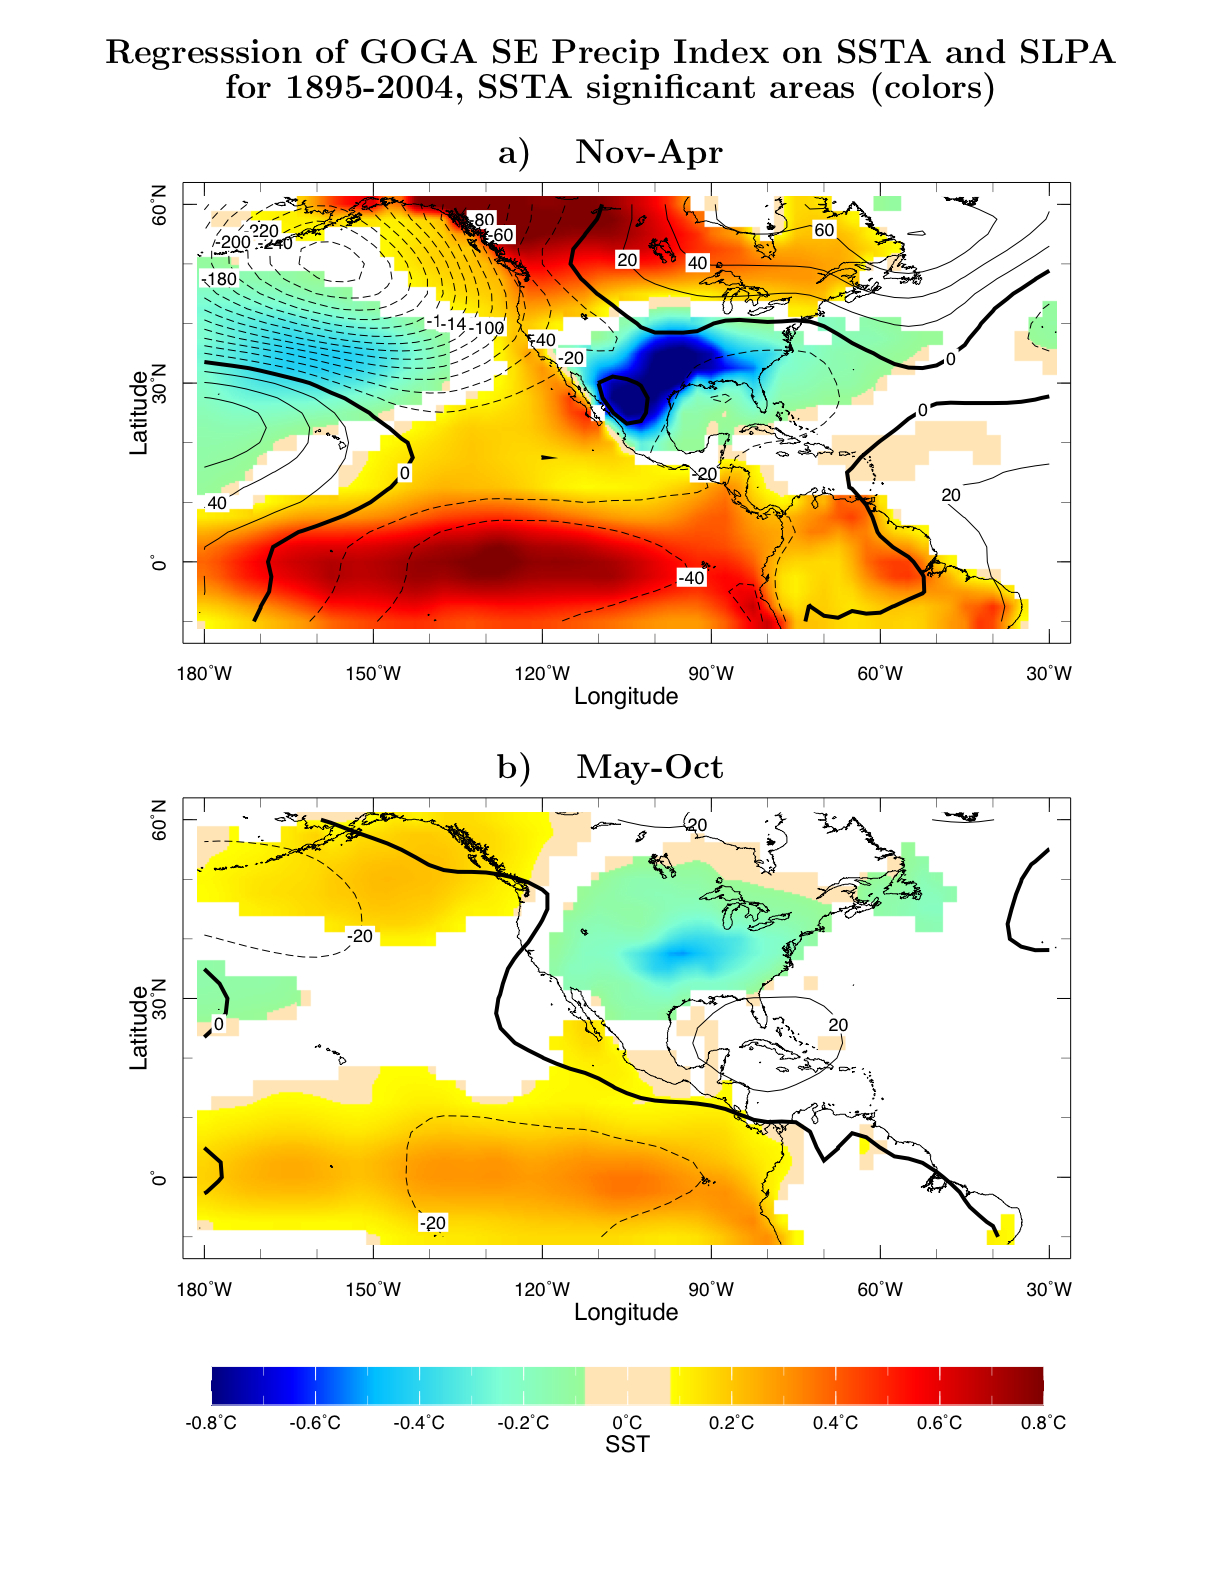
Models forced by observed SSTs have a stable winter link of dry condition to La Niña but also produce an even weaker dry southeast-La Niña link during the summer (Figure 5). As such winter precipitation in the southeast has limited predictability in winter - if tropical Pacific SSTs are predicted well - but there is no useful predictability in summer. Consistently the models do not simulate well the continuous 2005-7 southeast drought only producing that part of it that was consistent with winter La Niñas (winter 2005/6) (Figure 6).
-
Tree ring records show that much longer droughts of equal severity in any one year have occurred in the southeast and that the twentieth century appears to have been unusually wet by the standard of the last one thousand years (Figure 7). A 'megadrought' occurred in the sixteenth century and has been identified elsewhere in the eastern and central parts of the current US. Some of the Medieval megadroughts that were centered in the West also impacted the southeast. In addition a long dry period ran from the beginning to the middle of the 19th Century (Figure 8). The causes of these more dramatic events is not well known (but see here for further details).
-
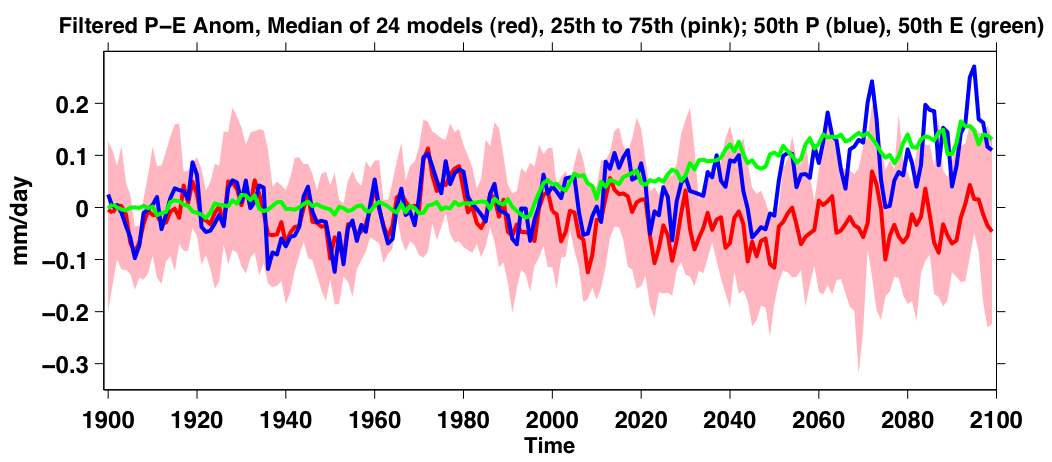
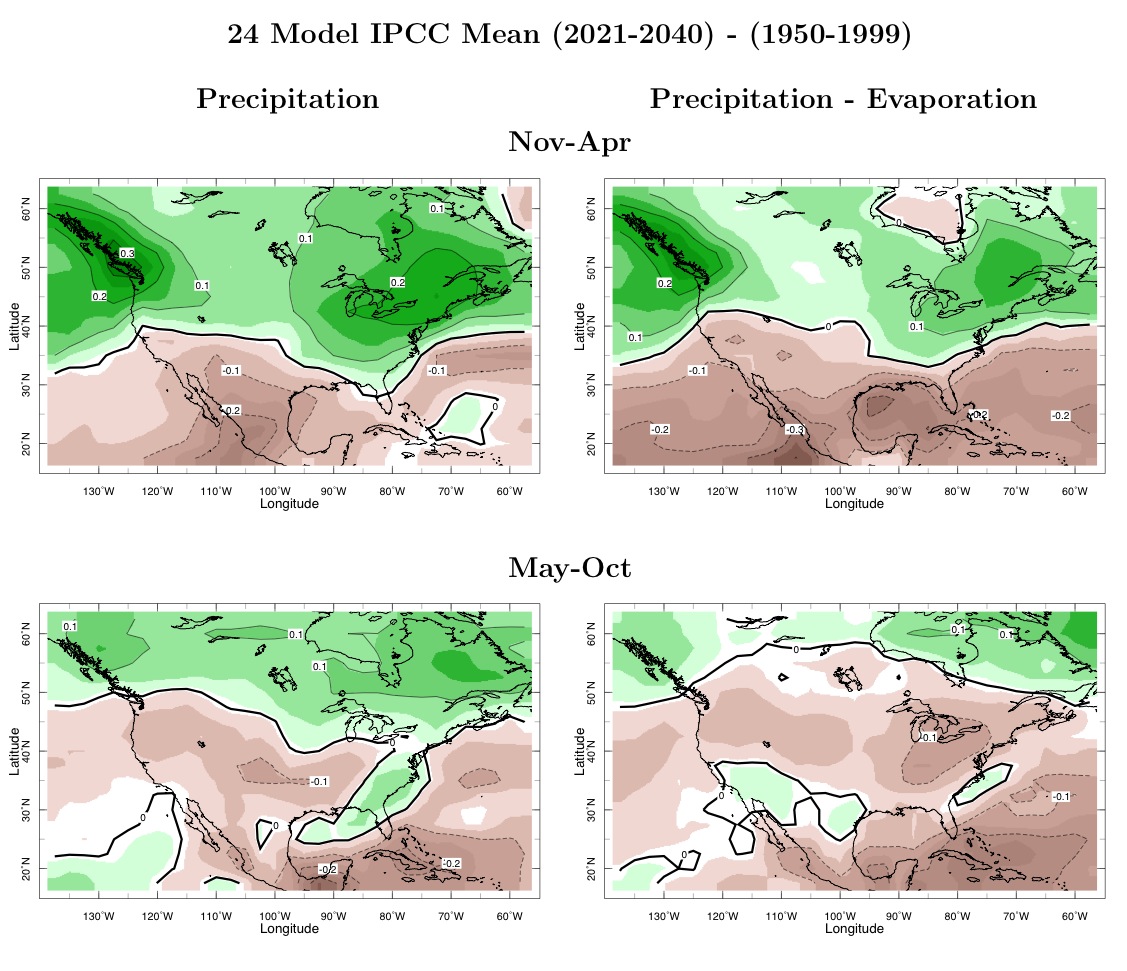
Unlike the southwest models vary significantly in their projections of future hydroclimate change in the southeast (Figure 9). The southeast is on the poleward flank of the region of projected subtropical drying (Figure 10). In most models precipitation increases in the current century in the southeast but evaporation also increases. River flow and soil moisture are sustained by the difference, precipitation minus evaporation (P-E) and, hence, some models would project a decline in available water resources and some an increase. In other words climate change is as likely to increase stress on water resources in the southeast as it is to alleviate stress.
-
During the post 2005 drought it appears that evaporation was reduced as well as precipitation. There is no clear signal of anthropogenic climate change in this drought.
The post 2005 drought therefore appears to have been caused partly by atmosphere-ocean climate variability and partly by internal atmosphere variability, all of which is typical of what has been happening in the region for hundreds of years. The serious stress the drought put on social and agricultural systems in the region came about purely due to lack of adequate planning based on knowledge of regional climate variability. Belated planning now must also take into account the possibility that climate change will increase stress on regional water resources.
|
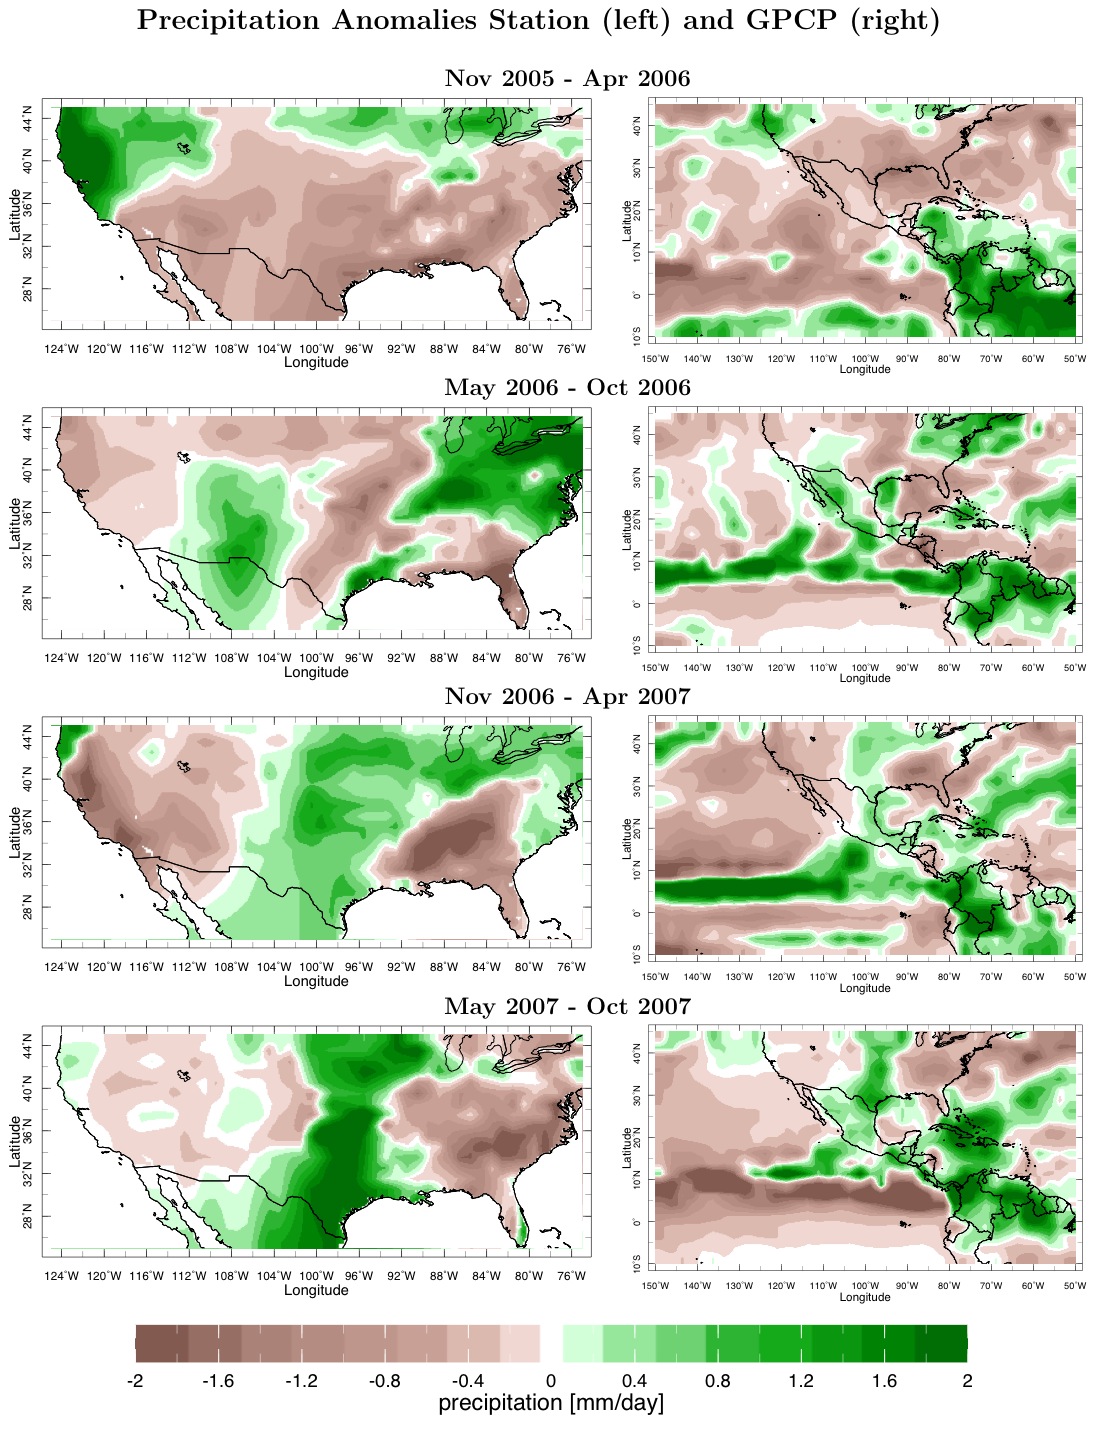
Figure 1. The precipitation anomaly for winter and summer half years from fall 2005 until fall 2007 as derived from climate division station data (left column) and GPCP satellite-gauge data (right column). The climate division data is relative to a January 1895 to March 2008 climatology and the GPSP data is realtive to a January 1979 to March 2008 climatology. Units are mm/day.
(Click to return to discussion)
|
|
|
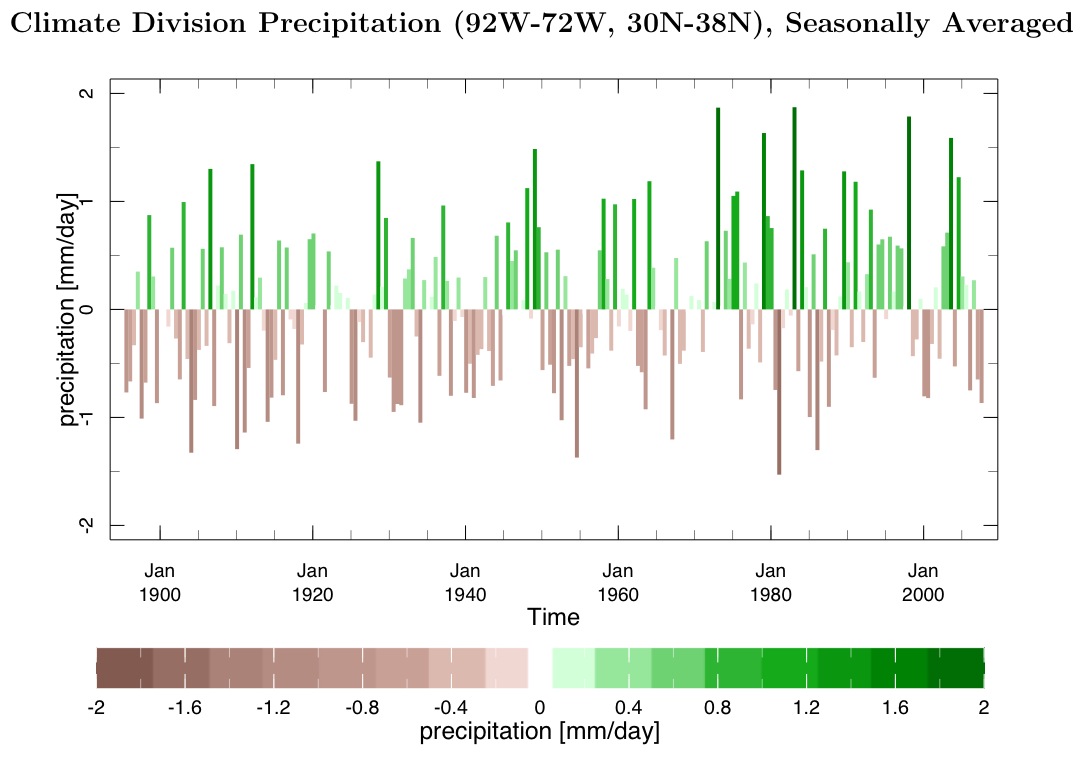
Figure 2.
The area averaged (92°W-75°W and 30°N-38°N) precipitation anomalies for winter and summer half years from 1995 to fall 2007 as derived from climate division station data. Values are plotted for November to Aoril and May to October half years and are realtive to the 1895 to 2007 climatology. Units are mm/day.
(Click to return to discussion)
|
 |
|
Figure 3.
The regression of the climate division area-averaged Southeast precipitation in November through April on the observed SST (colors) and SLP (contours). SST values are only plotted where they are statistically significant at the 5% level. Results are shown for three time periods: 1895-1921, 1922-1940 and 1941-2004. Units are Pascals and deg C.
(Click to return to discussion)
|
 |
|
Figure 4.
The regression of the climate division area-averaged Southeast precipitation in May through October on the observed SST (colors) and SLP (contours). SST values are only plotted where they are statistically significant at the 5% level. Results are shown for three time periods: 1895-1921, 1922-1940 and 1941-2004. Units are Pascals and deg C.
(Click to return to discussion)
|
 |
|
Figure 5.
The regression of the Southeast precipitation on SST (colors) and SLP (contours), all from the GOGA model ensemble mean for the November through April half year (top) and the May through October half year (bottom). SST values are only plotted where they are statistically significant at the 5% level. Units are Pascals and deg C.
(Click to return to discussion)
|
 |
|
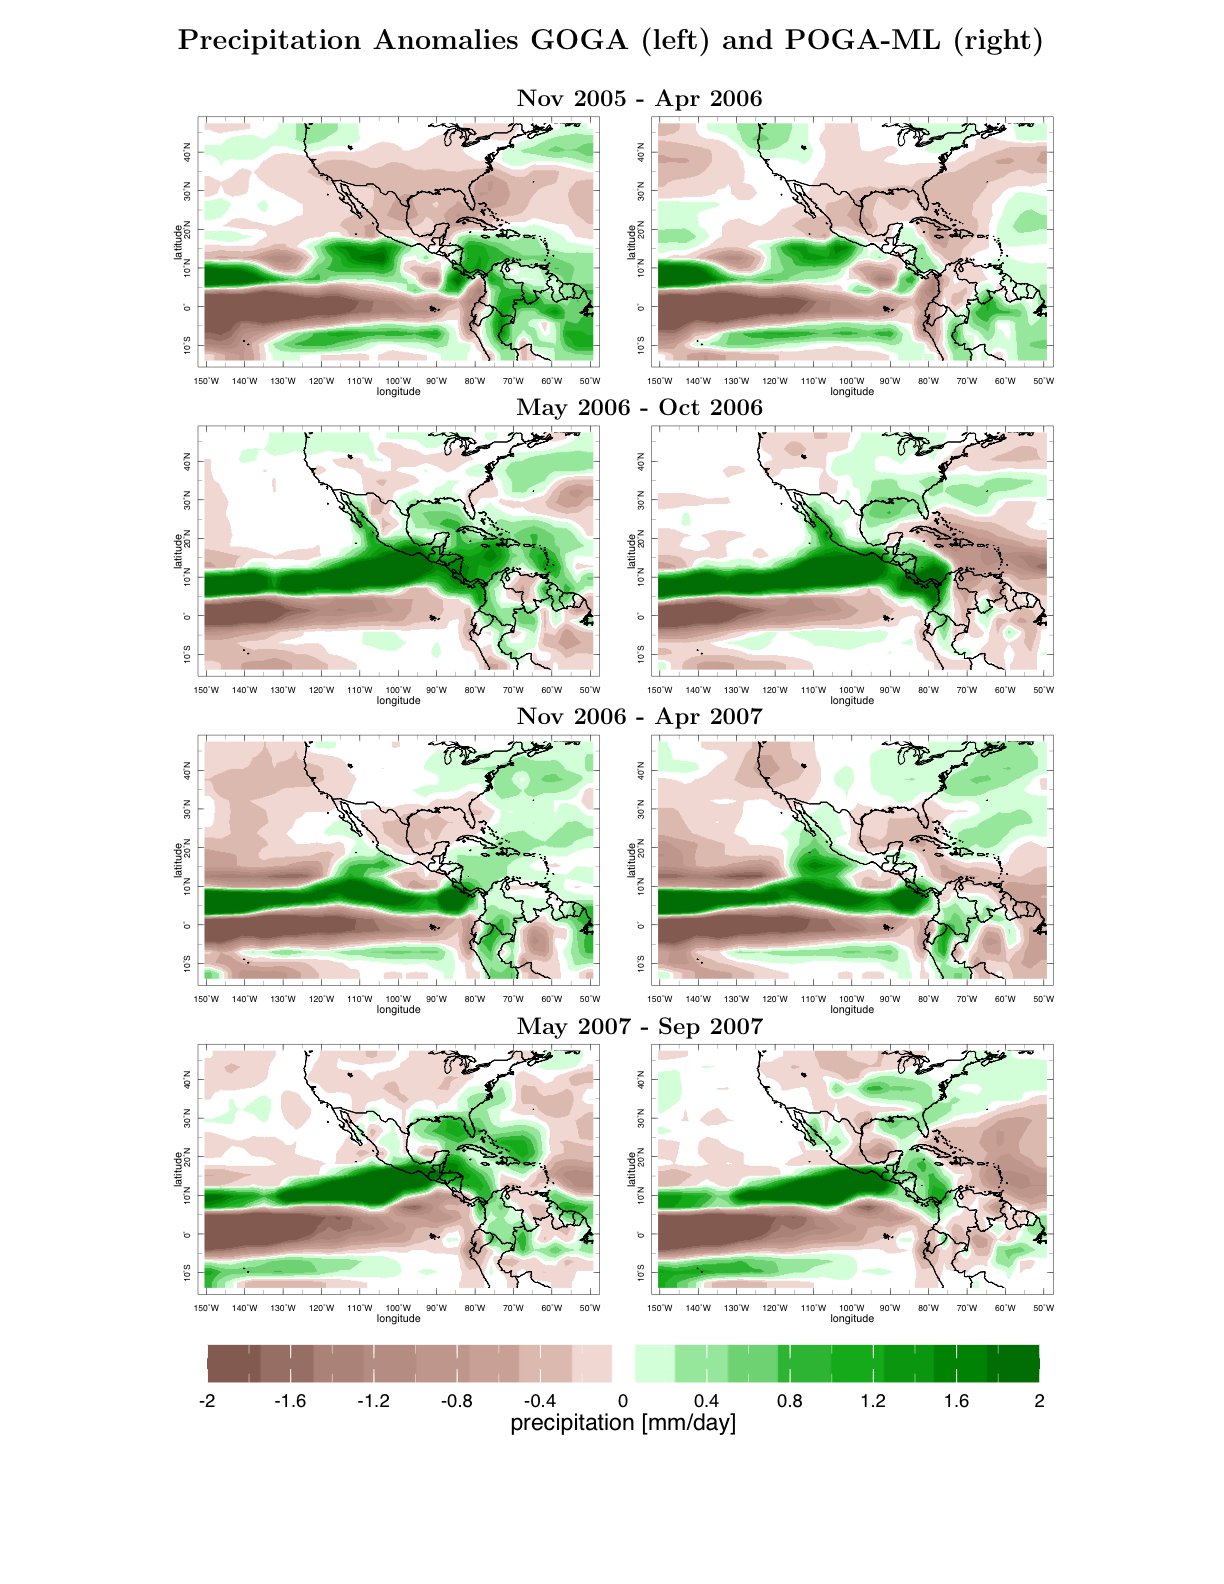
Figure 6.
The modeled precipitation anomalies for half years from winter 2005/6 through 2007 for the case of global SST forcing (GOGA, left) and tropical Pacific forcing alone (POGA-ML, right). Results are shown for the Pacific-North America-Atlantic domain and anomalies are relative to a post 1979 climatology to facilitate comparison to the satellite-gauge results shown in Figure 1. Units are mm/day.
(Click to return to discussion)
|
 |
|
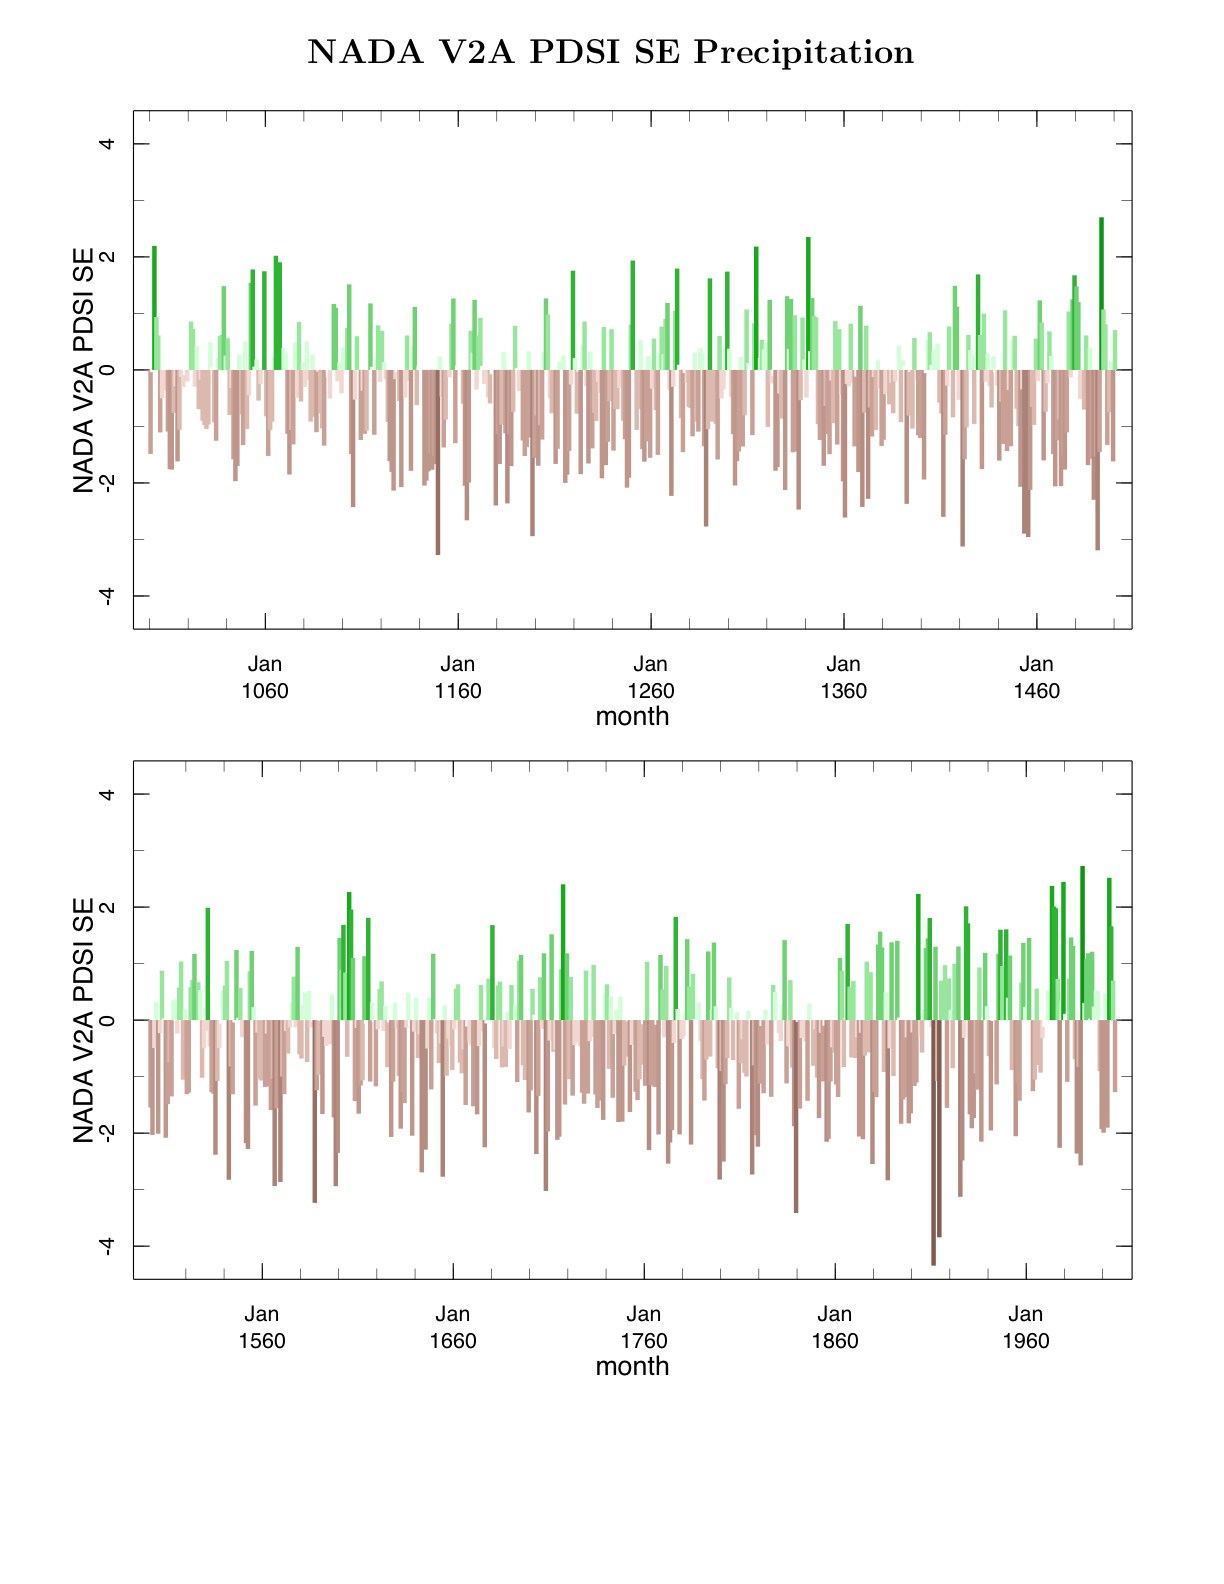
Figure 7.
The tree ring reconstructed PDSI averaged over the Southeast for the 1000 A.D. to 2006 A.D. period from the updated North American Drought Atlas.
(Click to return to discussion)
|
 |
|
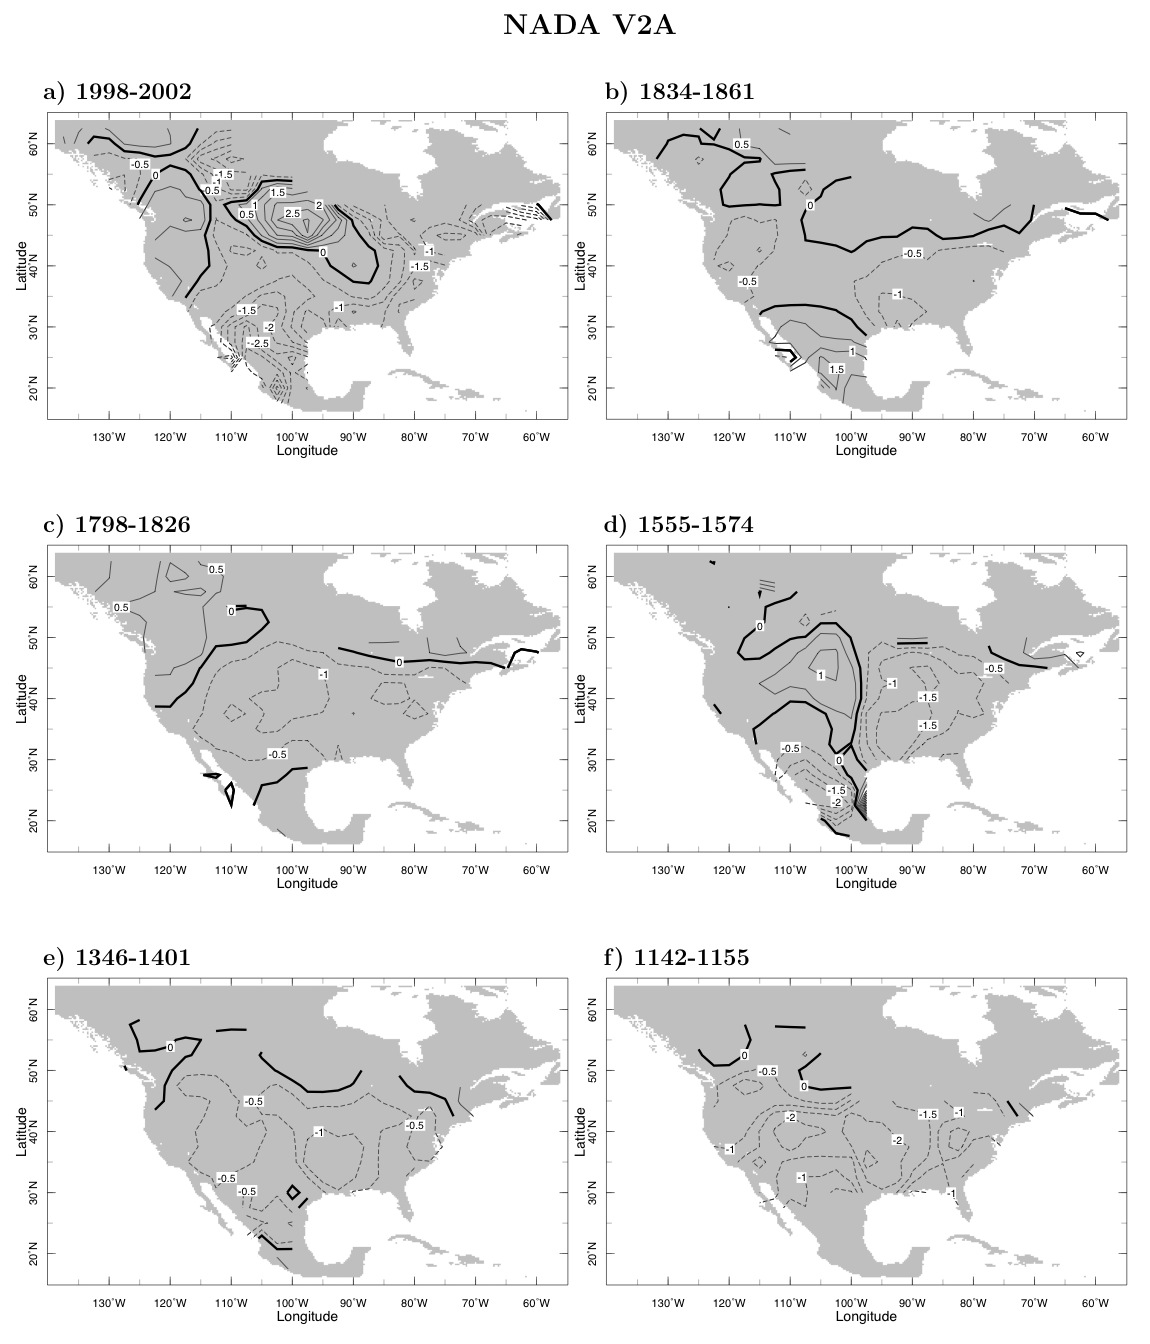
Figure 8.
Tree ring reconstructions of PDSI for the turn-of-the-century drought and for five previous multiyear droughts as recorded in the North American Drought Atlas. The five earlier droughts were chosen on the basis of both longevity and intensity to illustrate the potential in the Southeast for multiyear to decadal timescale droughts to occur.
(Click to return to discussion)
|
 |
|
Figure 9.
Modeled changes in annual mean precipitation minus evaporation over the Southeast (92°W-75°W, 30°N-38°N, land areas only) averaged over ensemble members for each of 19 models. The historical period used known and estimated climate forcings and the projections used the SResA1B emissions scenario. The red line shows the median P-E and the 25th and 75th percentiles of the P-E distribution amongst the models are shown by the pink shading. The ensemble medians of P (blue line) and E (green line) are also shown. Results are for the period common to all models (1900 to 2098) and anomalies for each model are relative to that model's climatology for 1950-2000. Results have been six year low pass Butterworth filtered to emphasize low frequency variability. Units are in mm/day. The climatological 1950-1999 model ensemble mean P-E in this region is around 0.8 mm/day.
(Click to return to discussion)
|
 |
|
Figure 10.
The change in P (left) and P-E (right) for 2021-2040 minus 1950-1999 as projected by the ensemble mean of 24 IPCC AR4 models using the SResA1B emissions scenario for the current century. Units are mm/day. Results are shown for the winter half year (top) and the summer half year (bottom).
(Click to return to discussion)
|
 |
REFERENCES
-
Seager, R., A. Tzanova and J. Nakamura, 2009: Drought in the Southeastern United States: Causes, variability over the last millennium and the potential for future hydroclimate change, Journal of Climate, 22, 5021-5045. PDF
-
John Manuel, 2008: Drought in the Southeast: Lessons for Water Management, Environmental Health Perspectives Volume 116, Number 4, April 2008.
link
|

|